
Project health
Interpret project health snapshots, dataset scope, scorer averages and percentiles, pass rates, and item-level drill-downs.
Project Health combines evaluation results from a project’s datasets with recent token and cost telemetry. Use it to find a scorer or dataset that needs investigation, then open the underlying item and source trace.
Open Project → Health.
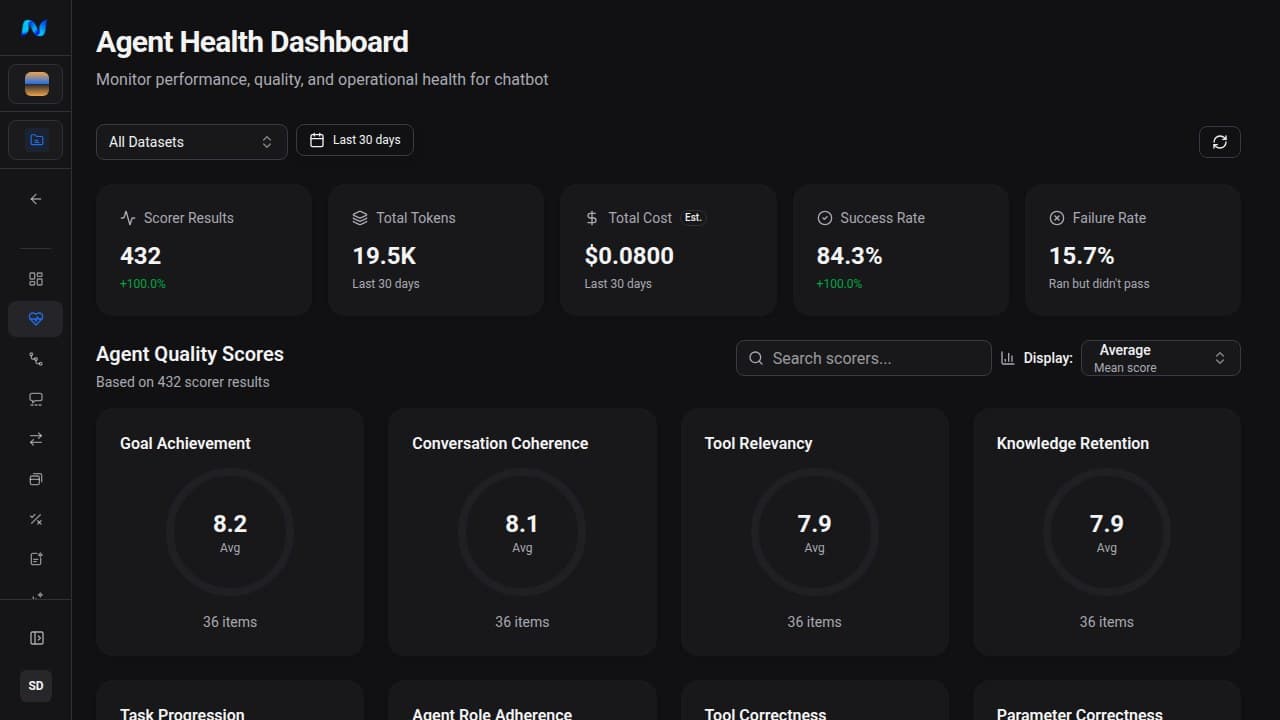
Read the page in order
Which datasets are included
Health uses the union of:
- datasets whose stored
project_idis the current project; and - organization datasets manually associated with the project.
This union is intentional. A dataset created by a project remains in its health scope even if an older association list was not populated, while a shared dataset can be added to several relevant projects without copying its items.
Use Project → Settings to associate an existing dataset. The Health dataset selector shows the resulting owned-and-associated scope.
Snapshot behavior
The main Health page reads a precomputed project-health snapshot. The rollup currently examines:
- scorer results for every included dataset;
- project model and voice telemetry from the preceding 30 days for token and cost totals.
If no snapshot exists, the API returns an empty health payload rather than running a live aggregation. To recompute it, open the project Overview and select Update now. The circular refresh button on Health only reloads the latest stored snapshot.
The token and cost cards use the preceding 30 days of project telemetry. They are not judge-only usage, and the dataset filter does not change these two project-wide cards.
Summary cards
| Card | What it currently means |
|---|---|
| Scorer Results | Total scorer-result count in the selected dataset scope, including scorer errors |
| Total Tokens | Tokens on cost-bearing project model spans in the rollup window |
| Total Cost | Reported cost with model-aware LLM and STT/TTS estimation fallback |
| Success Rate | Valid scorer results whose saved scorer decision is passing, divided by valid results |
| Failure Rate | Valid scorer results whose saved scorer decision is failing, divided by valid results |
Scorer Results is not the number of eval-job executions or distinct dataset items. If 36 items each have 12 scorer results, the card shows 432. Use a scorer card’s item count and detail table when you need the count for one scorer.
Scorer errors remain visible in the result count and detail rows, but they are excluded from pass/fail rates, averages, minimums, maximums, and percentiles. Inspect the error column in the detail view instead of treating a scorer failure as an application-quality failure.
Scorer cards
Health groups results first by scorer and dataset, then combines the selected datasets into one card per scorer. Search filters scorer names. The display selector supports:
- Average - valid-result-count-weighted mean score across datasets;
- P75, P90, P95, and P99 - valid-result-count-weighted combinations of each dataset’s stored percentile.
The snapshot-backed cards use ordinary quantiles: P75 is the score at or below which roughly 75% of results fall, and P99 is near the high end of the distribution. Because most Noveum scores are better when higher, these high quantiles emphasize the stronger side rather than the failing tail.
The live drill-down uses the same percentile direction as the snapshot-backed cards. Its aggregates also exclude invalid negative sentinel values, so a card and detail row are comparable once they cover the same dataset scope and snapshot time.
Do not compare averages or percentiles across scorers until you have confirmed that their scales, pass semantics, and error handling are compatible. A numerical score is not automatically commensurate with another scorer’s score.
Scorer detail
Select a scorer card to open its project-scoped detail. The page shows:
- evaluation-count-weighted average for this scorer and total evaluation count;
- one row per dataset with environment, average, minimum, maximum, P75, P90, P95, P99, and pass/fail counts;
- expandable individual results with item ID, score, pass state, execution time, error, update time, metadata, and reasoning;
- a source-trace link when the dataset item retained that relationship.
The scorer detail reads scorer results directly rather than only reusing the main page’s snapshot. It can therefore show newer results than the cards until the next health rollup.
Sort item results by score to find the lowest valid results, by error to isolate scorer failures, or by update time to inspect a recent evaluation. Read the reasoning beside the normalized dataset fields, then follow the source trace to verify the claim against the original execution.
A reliable investigation flow
- Select one dataset instead of starting with All Datasets.
- Find the scorer with the clearest regression or non-pass count.
- Open its detail and sort individual results by score ascending.
- Separate scorer execution errors from valid low scores.
- Open the dataset item and check whether the mapper supplied the scorer’s required fields.
- Follow the source trace in Explorer and inspect the responsible span.
- Change the application, mapper, scorer, or pass rule only after the evidence identifies which layer is wrong.
Why Health can be empty
- No owned or associated dataset exists for the project.
- The included datasets have no scorer results.
- Results arrived after the latest project-health snapshot.
- The dataset slug in the eval job does not match the included dataset.
Start by confirming the dataset under Project → Datasets, then the completed run under Eval Jobs. If the item results exist, run Update now from Overview and wait for the rollup to finish.
Health versus Analytics and Runs
| View | Best for |
|---|---|
| Organization analytics | Organization-wide traffic and quality trends |
| Project Health | Project/dataset scorer aggregates and item-level drill-down |
| Review conversations in Runs | One conversation or workflow in sequence, with per-turn checks |
| Explorer | Raw trace and span evidence |