
Organization analytics
Read organization performance and quality snapshots, understand trace, turn, model, and hallucination metrics, and investigate changes in Explorer.
Organization Analytics summarizes trace traffic and evaluation quality across the active organization. Use it to find a project, time window, model, or scorer signal that needs investigation, then open the source traces, dataset items, and scorer results.
Analytics has Performance and Quality tabs. They use the same controls in the header, but they do not currently have the same filtering behavior.
Refresh the snapshot
Update now queues a new analytics snapshot. The update can take a few minutes. The adjacent refresh action reloads available data; it does not create a new snapshot.
The last-updated label tells you when the current snapshot was generated. Refresh the snapshot before making a release decision if new traces or scorer results arrived after that time.
Read Performance
The project and date-range controls apply to Performance metrics and charts. The default range is the last 30 days. Timezone and interval controls change chart presentation and bucketing where supported.
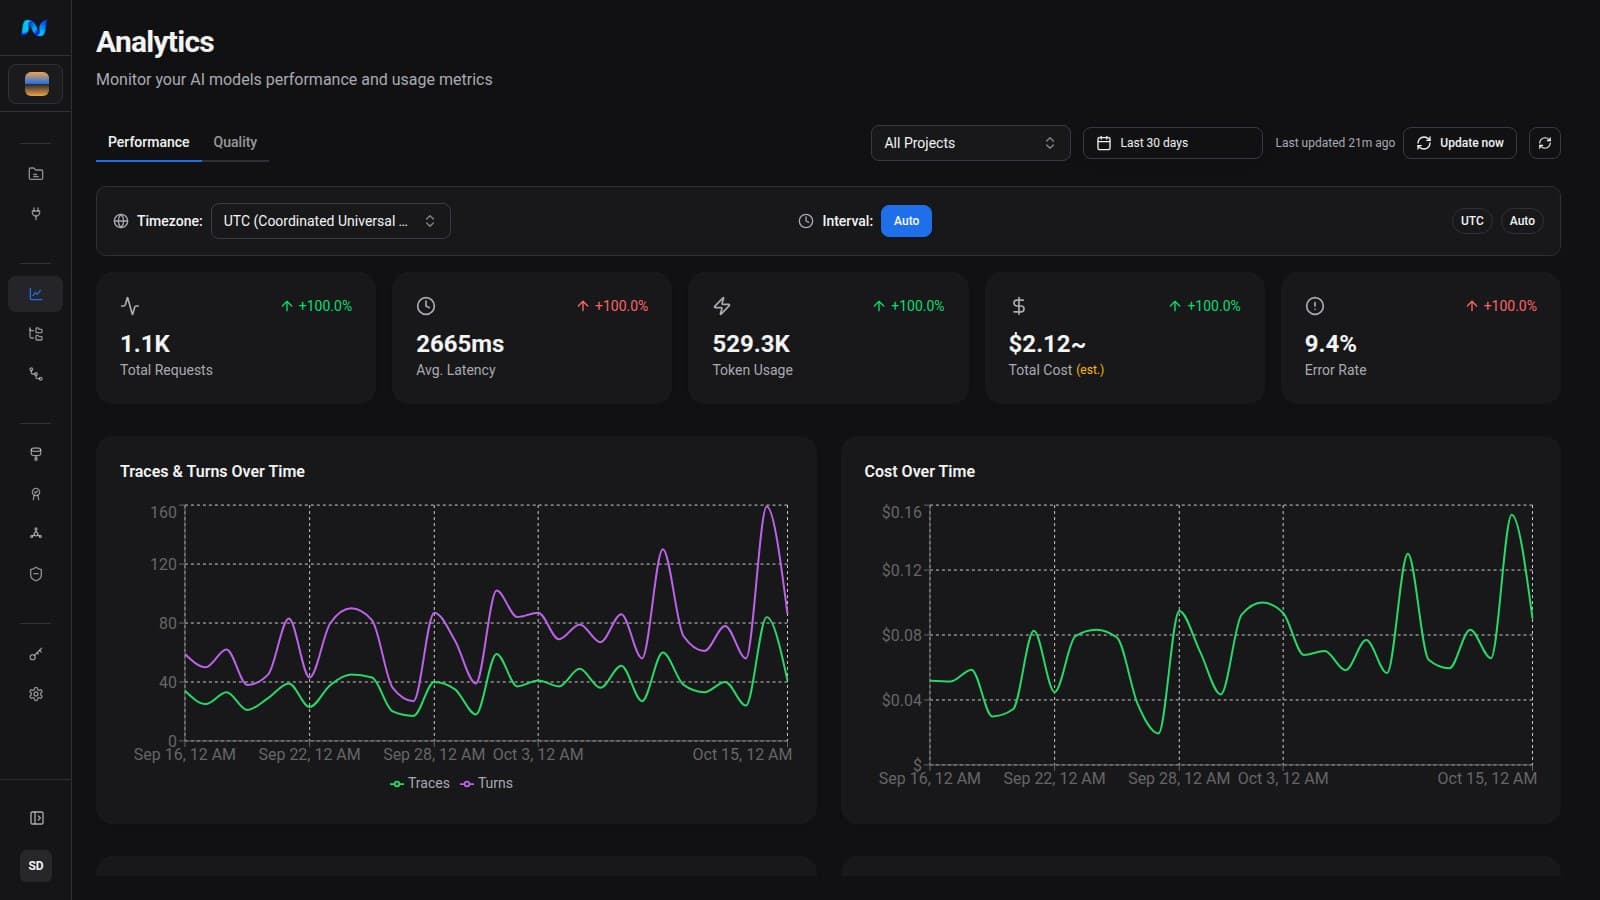
The summary cards cover:
| Metric | Meaning |
|---|---|
| Total Requests | Trace count in the selected Performance scope. |
| Average Latency | Average end-to-end trace duration in that scope. |
| Token Usage | Recorded model input and output token usage. |
| Total Cost (estimated) | Cost derived from recorded usage and configured estimation rules. Treat it as an estimate. |
| Error Rate | Error traces divided by traces in the selected scope. |
Traces and Turns Over Time
Traces is the number of recorded traces in each bucket.
Turns uses the positive conversation.turn_count recorded on a trace. If that value is absent or zero, Analytics falls back to the number of LLM spans in the trace. Turns can therefore exceed traces, and an instrumentation change can alter the series even when request volume is stable.
Token Usage by Model Over Time
Only model series with positive token usage are charted. The eight models with the largest total token usage remain named. Any additional positive model series are summed into Other for each time bucket.
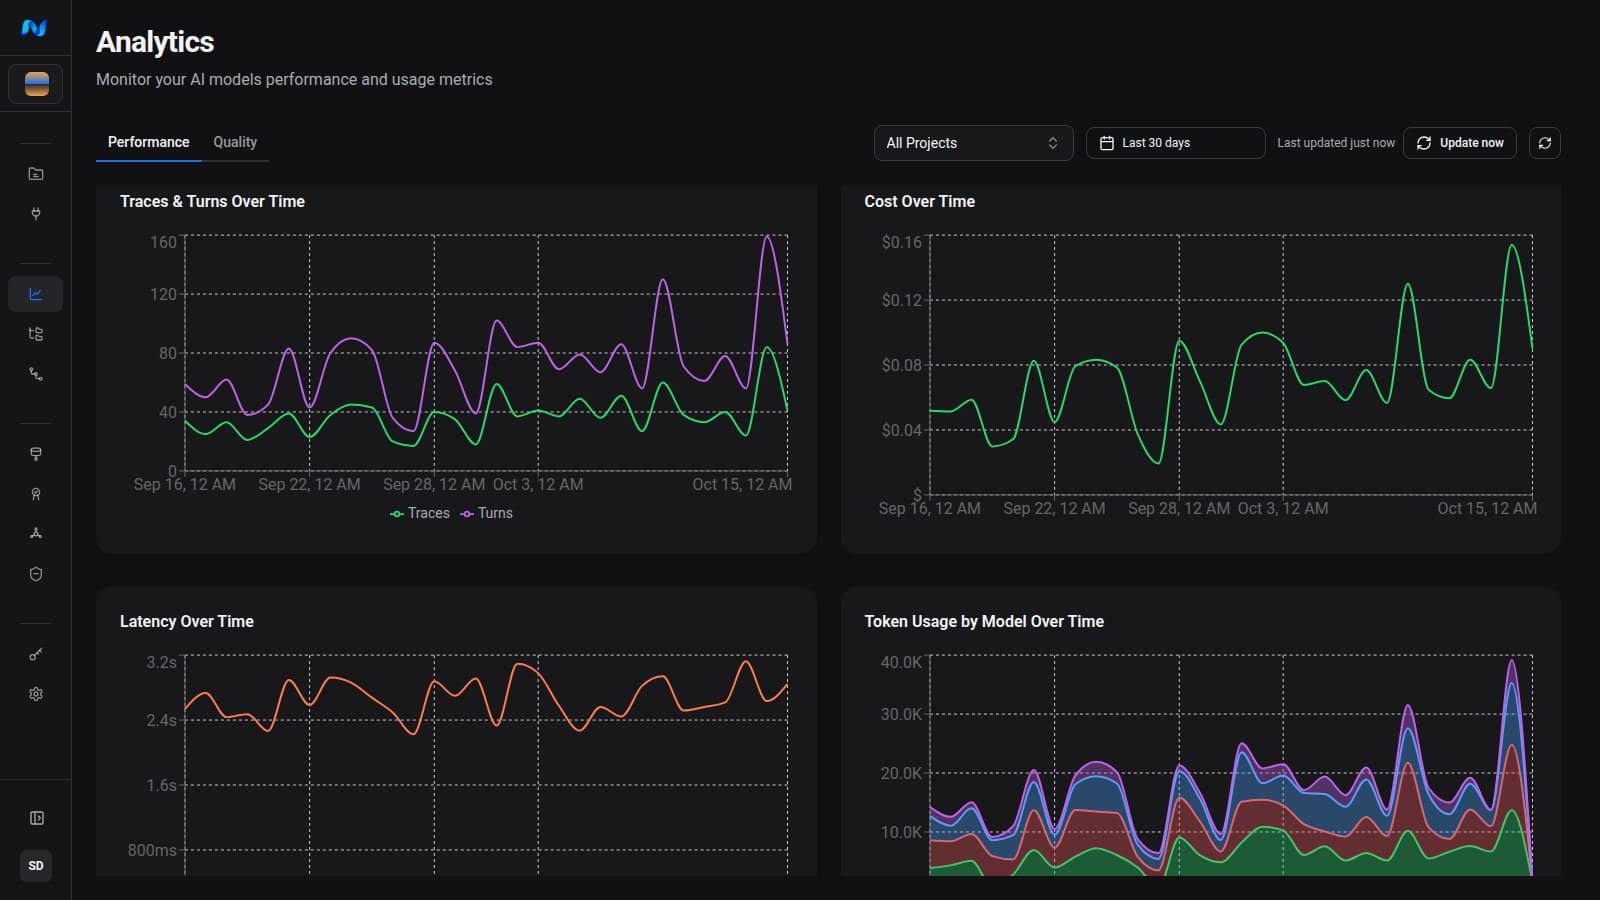
Use the model chart to find a change, then filter Explorer or All Traces by the same project and time window. Confirm recorded model and token attributes on individual spans before changing routing or budgets.
Read Quality
Quality summarizes evaluation activity and scorer outcomes stored in the organization analytics snapshot. It includes summary cards, activity, hallucination rate, top failed scorers, and scorer failure rates.
The Quality API currently returns an organization snapshot. The visible project and date-range controls do not filter Quality, including Hallucination. Use those controls for Performance only until a filtered Quality endpoint is available.
Quality metrics should lead to item-level evidence. Open the relevant eval result, dataset item, and source trace before deciding that an application change is required.
Understand Hallucination Rate
The Hallucination chart uses scorers with the exact hallucination tag. Results from similarly named scorers without that tag are not included.
For each scorer, dataset item, and dataset combination, the rollup uses the latest valid non-error result. A trace is evaluated when a linked dataset item has a valid hallucination result. It is flagged when any linked valid result has passed = 0.
The displayed values mean:
| Value | Definition |
|---|---|
| Hallucination Rate | Flagged evaluated traces divided by evaluated traces, multiplied by 100. |
| Evaluated Traces | Traces with at least one valid linked hallucination result. |
| Flagged Traces | Evaluated traces with at least one linked valid result where passed = 0. |
| Clean Traces | Evaluated traces minus flagged traces. |
| Coverage | Evaluated traces divided by traces in the snapshot activity window, capped at 100 percent. |
| Valid Scorer Results | Valid hallucination scorer-result rows linked to dataset items. |
| Failed Scorer Results | Those valid linked result rows whose verdict failed. |
Valid and failed scorer-result counts are not deduplicated conversational turns. Multiple hallucination scorers can contribute multiple rows for the same item.
Investigate an analytics change
Continue with Choose the right dashboard, Review evaluated Runs, or The closed-loop workflow.