
Explore traces and datasets
Use the organization Explorer directory, result list, and detail pane to investigate trace traffic and mapped dataset items across projects.
Explorer is the organization-wide three-pane investigation workspace. Use it when you want to browse ownership and environment before selecting a trace or dataset item. If you already know the project, Project Traces is the faster flat-table view.
Understand the three panes
| Pane | Purpose |
|---|---|
| Directory tree | Choose the Traces or Datasets topology and narrow the active organization scope. |
| Result list | Search, scan, and select traces or dataset items inside that scope. |
| Detail pane | Inspect the selected trace, span, or dataset item without leaving Explorer. |
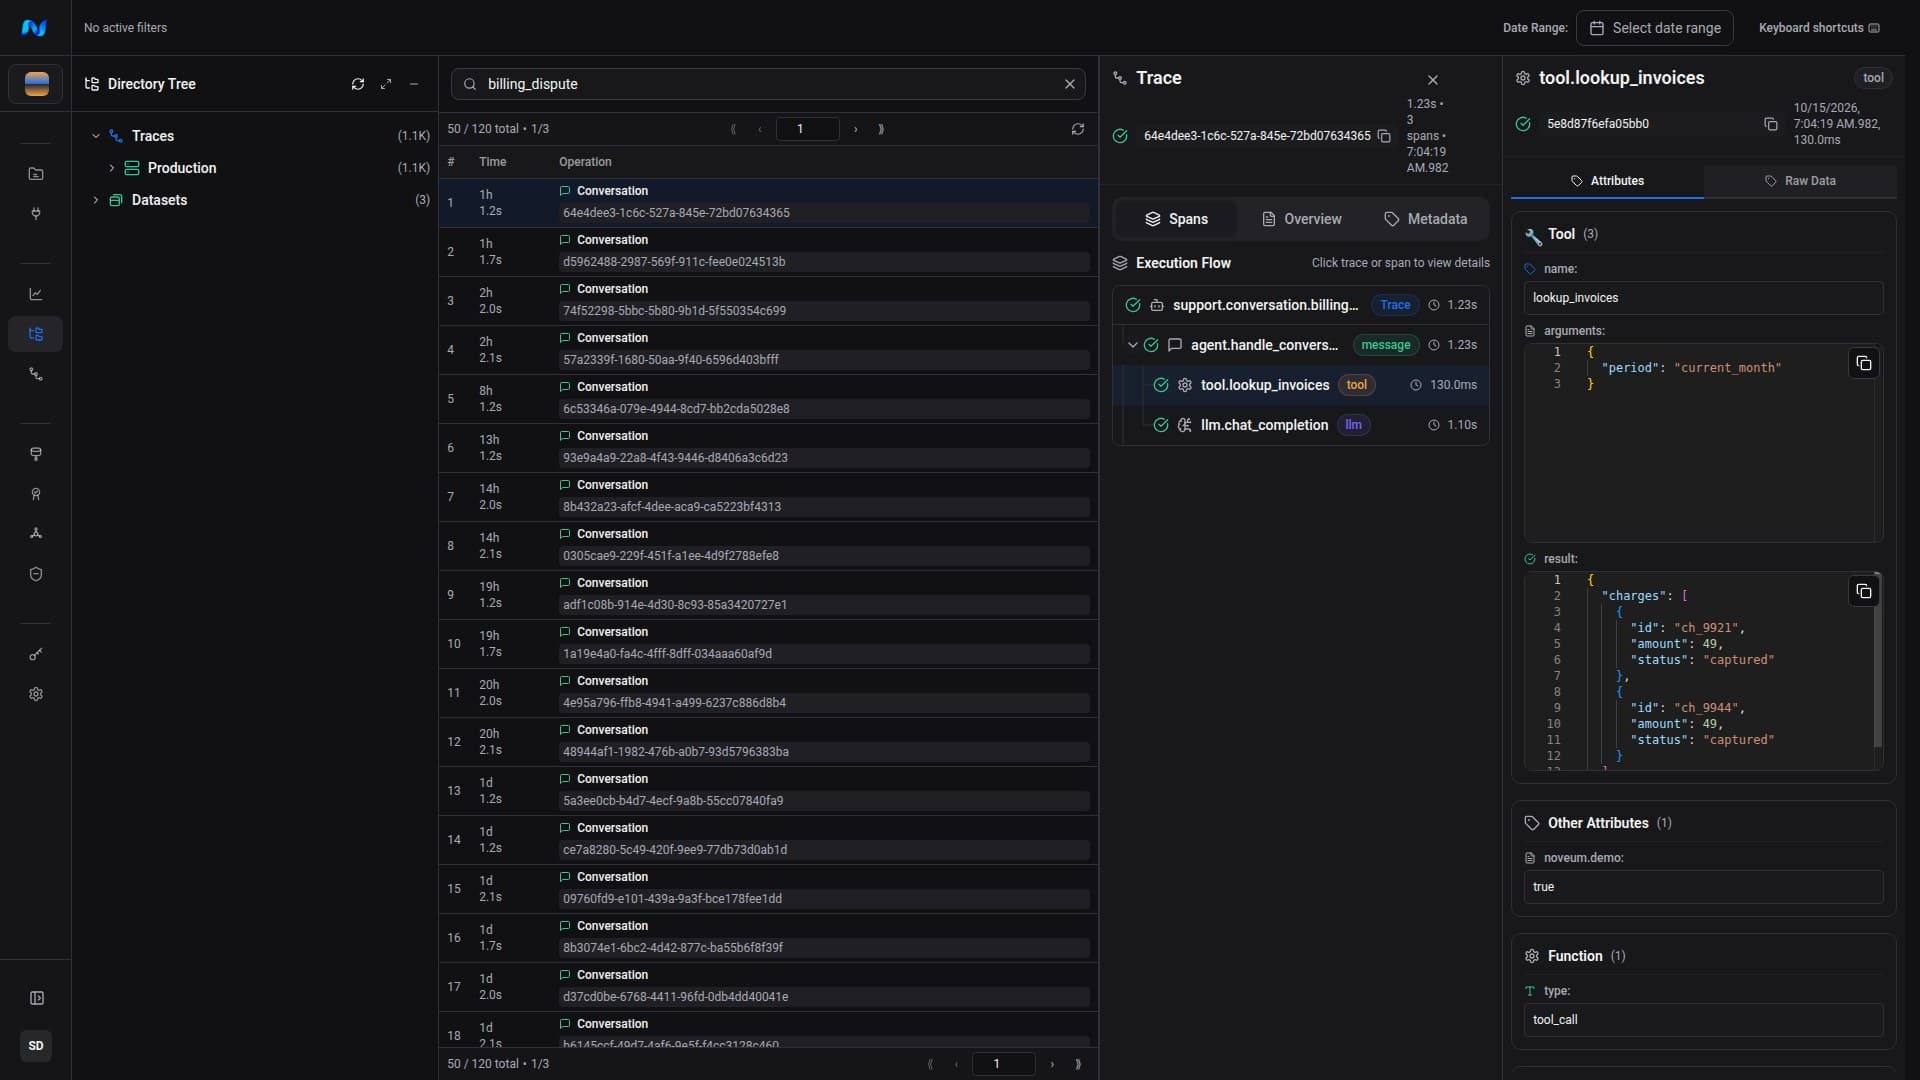
Open Explorer from organization navigation at /app/{organizationSlug}/explorer.
Browse the directory
The directory has two roots:
- Traces groups recorded telemetry by environment category, reported environment, and then project.
- Datasets lists organization datasets whose items can be inspected in Explorer.
The directory does not add a service-name node. Use the structured Service name filter after selecting a trace scope. Environment values come from recorded telemetry; they are not a separate list that Explorer creates.
Select a node to apply its scope to the middle pane. Refresh the tree when new telemetry or datasets have arrived. Expanding or collapsing a node changes presentation only.
Search and filter traces
Start with the date range, choose a directory scope, and then add filters.
| Filter | Typical use |
|---|---|
| Project | Restrict an organization search to one application. |
| Environment | Separate production, staging, development, test, or another reported value. |
| Status | Find ok, error, or timeout traces. |
| User ID | Follow traffic recorded for one user identifier. |
| Session ID | Find traces recorded for one conversation or session. |
| Service name | Separate services or SDK emitters. |
| Date range | Match an incident, release, or customer report window. |
Free-text trace search matches trace name, trace ID, project, environment, status message, user ID, session ID, request IDs, attributes, tags, and custom attributes. It does not promise a match for every field whose name ends in _id.
When searching spans, free text covers span name, status, attributes, and events. Filters combine with directory scope. If a known result is missing, widen the date range and clear filters before changing the project scope.
Inspect a trace
Captured prompts, responses, tool data, media, token usage, cost, and voice timings appear only when the integration emitted supported fields and the viewer is authorized to access them.
Inspect a dataset item
Select Datasets, choose a dataset, and then select an item. The detail pane shows the item's mapped content, metadata, scores, and source links when those fields exist.
Use this path to validate an ETL mapping:
- Open the mapped item and note its source trace identifier.
- Follow the source link to the original execution.
- Compare the item fields with the source trace and span attributes.
- Fix and preview the mapper if required context is missing or the wrong operation was selected.
Use the dedicated Datasets guide for versioning and item operations. Use Runs when the dataset should be read as a transcript or step sequence with evaluation results.
Investigation patterns
Compare a release
Choose one project and environment, then use recorded service_version values to compare traffic before and after deployment. Keep the date window wide enough to include both cohorts.
Follow a conversation
Filter by session_id when one conversation spans multiple traces. If ETL has produced conversation items, open the project's Runs workspace for the joined transcript and checks.
Localize an error
Filter status to error, select a trace, and inspect spans in execution order. Parent spans can inherit failure state, so find the first causal error by comparing timestamps, status messages, events, and attributes.
Explain an analytics change
Carry the same project and date range from Organization Analytics into Explorer, then narrow with supported status, service, environment, identifier, and text filters. Inspect duration and model details on the selected traces to identify the contributing population.