
Run an ETL job
Choose which traces to process, run the job, read the results, and troubleshoot per-trace failures.
Once your mapper is written and the job is marked as configured, running it is where you decide which traces become dataset items. That choice matters: pull in too little and your evaluations are not representative; pull in everything and you wait a long time for items you will never look at.
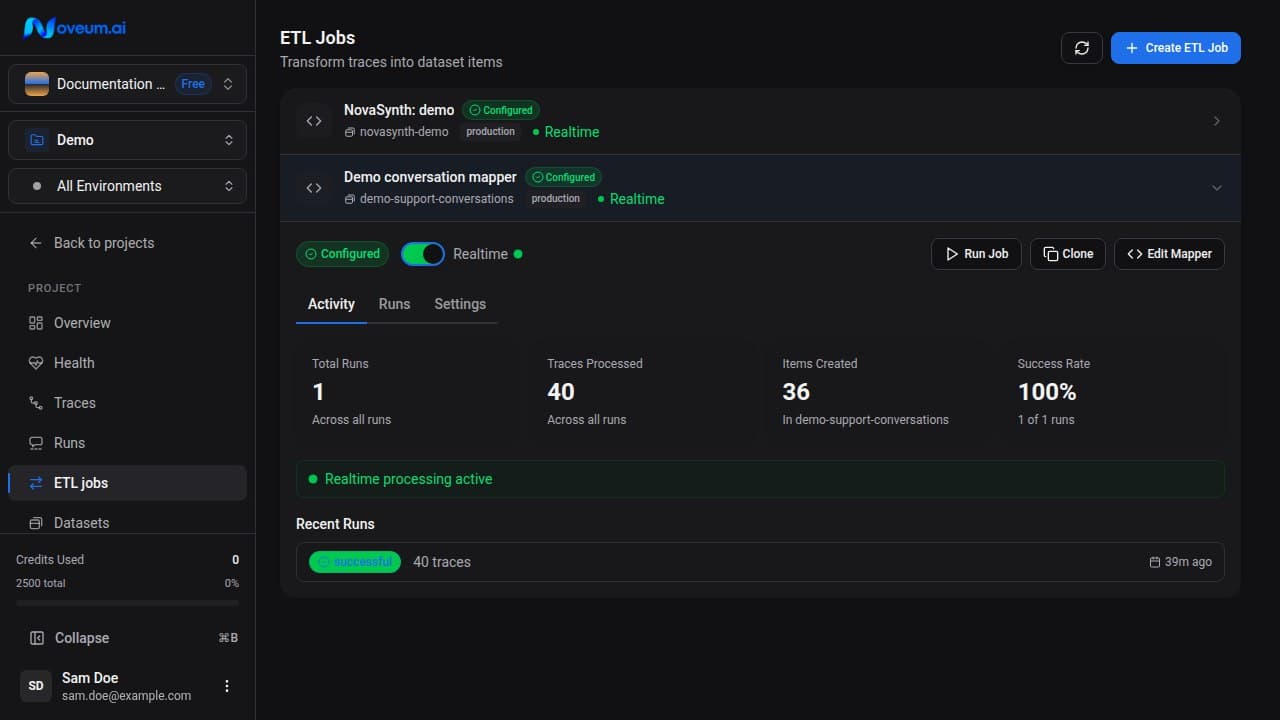
Before you start
The job must have a saved mapper and show Configured. Preview that mapper against a recent trace, confirm the destination dataset, and start with a bounded population when the mapper is new or recently changed.
Run a filtered batch
Press Run Job and pick a selection mode.
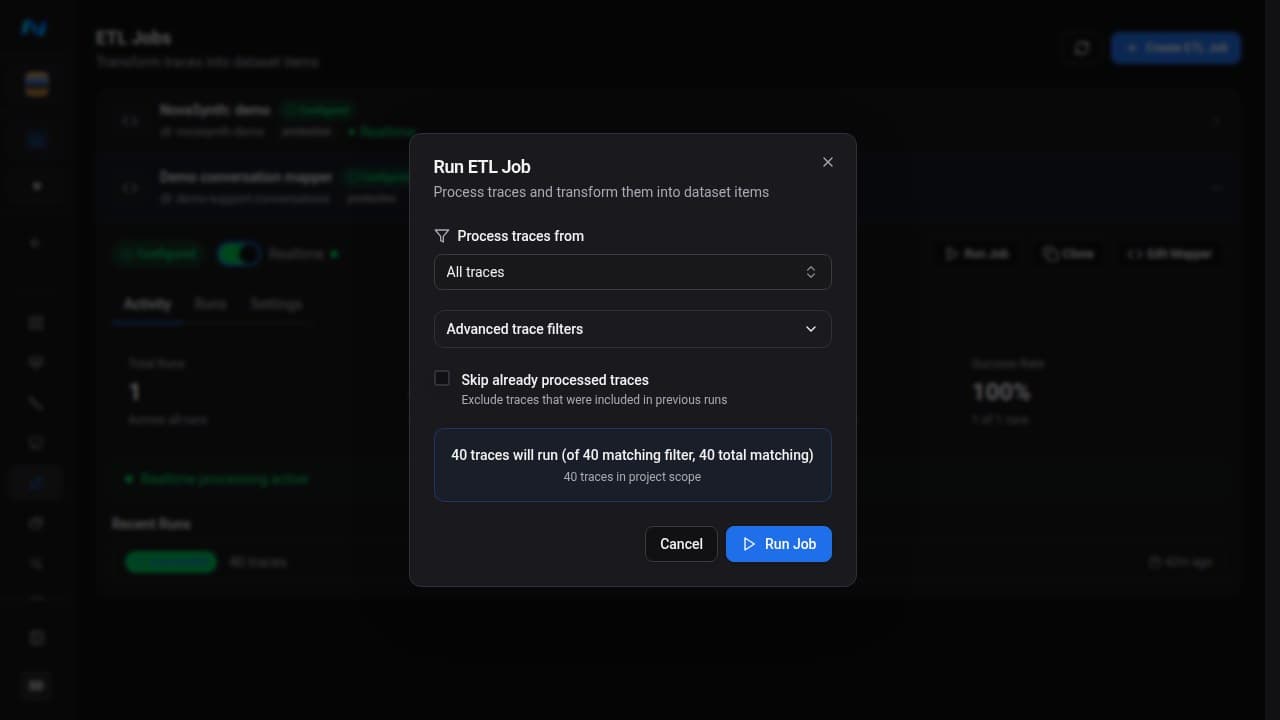
By count - the last 50, 100 or 200 traces, or a number you type from 1 through 100,000. Good for a first run, when you want to see what the mapper produces before committing to a large batch.
By time - the last 1, 7, 30 or 90 days, all traces, or a custom date range. This is the mode you want for a regular cadence, because it lines up with how you think about your traffic. A time range or All traces can match more than 100,000 records; the preview may show a truncated or unavailable count, and the run processes at most the first 100,000 matching traces.
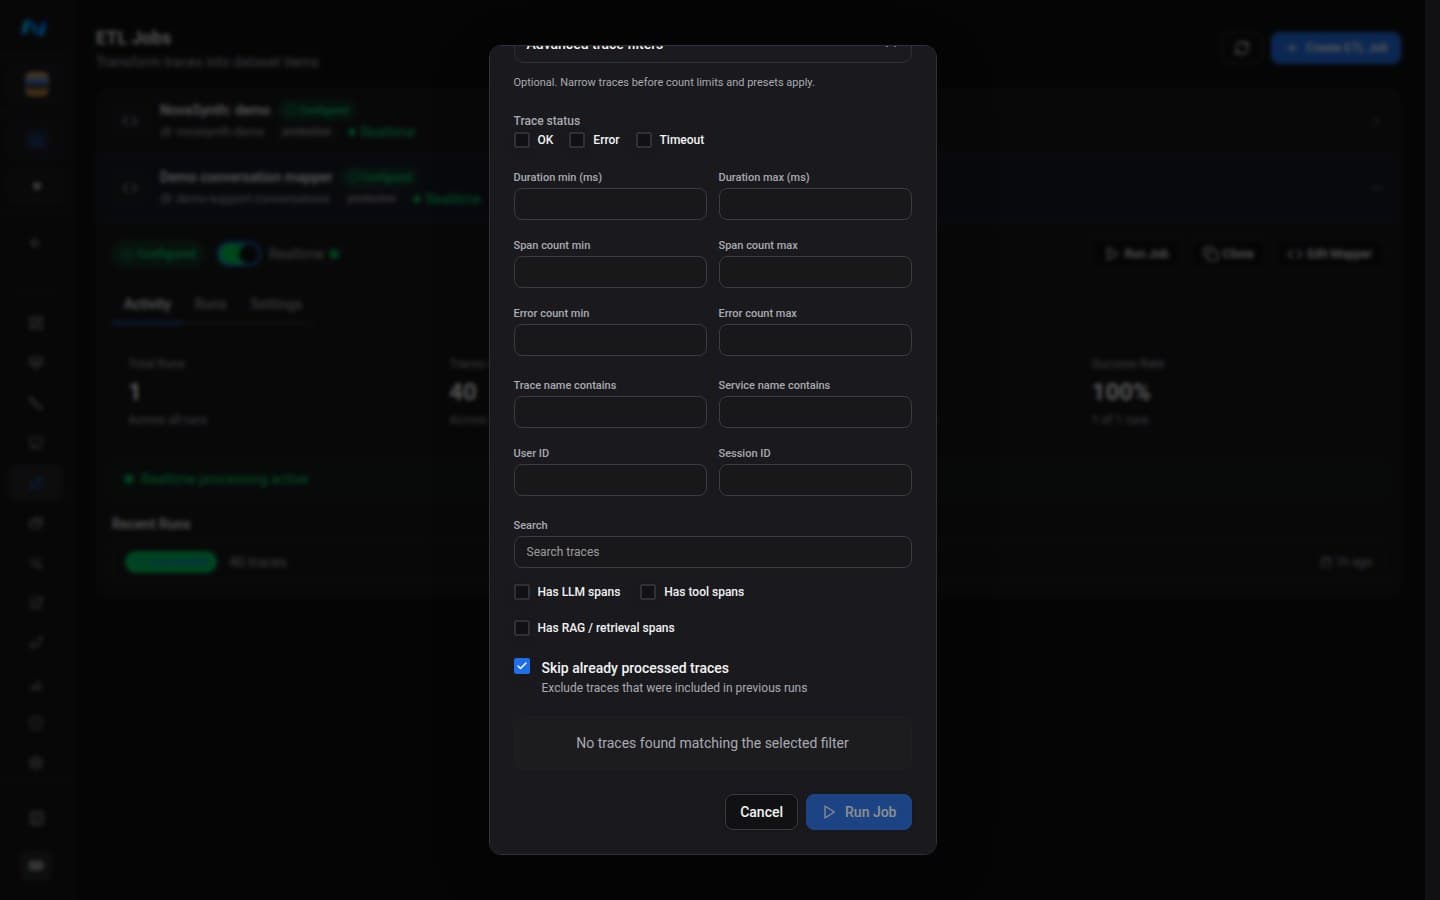
Skip already processed traces is on by default and should usually stay on - it stops the same trace producing duplicate dataset items across runs.
The dialog restores the job's saved default filter configuration when one exists. Before choosing Run Job, wait for the preview to settle and confirm:
- Will process is the population you intend;
- Filtered reflects the current selection and advanced filters;
- Already processed explains what the skip option removes;
- the saved job project, environment, and population are the intended source scope.
Narrowing further
Advanced trace filters opens the full set. Every one of these is optional, and they combine.
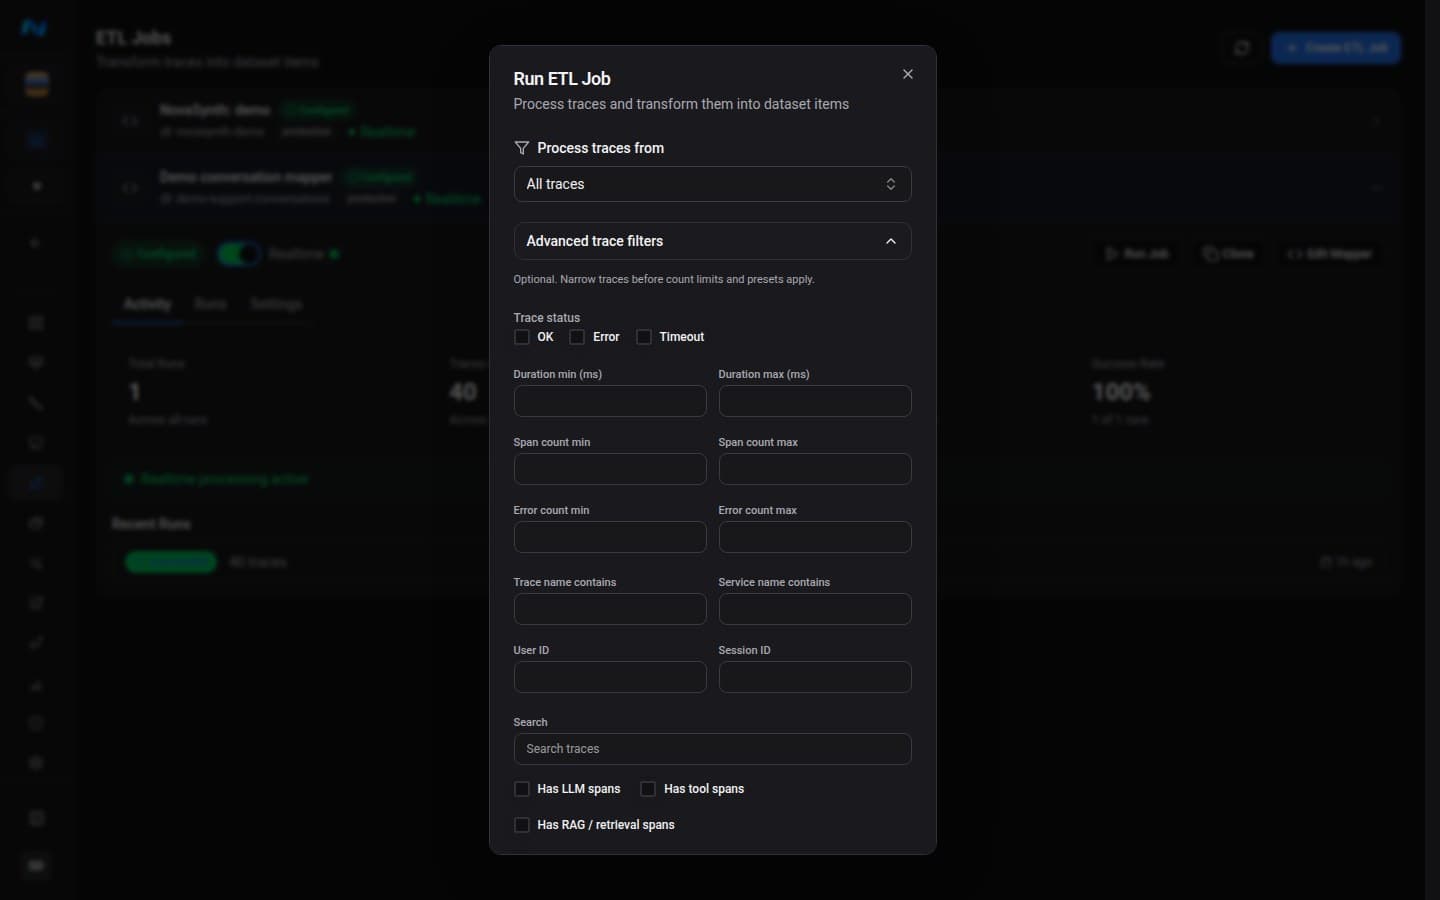
| Filter | Selects |
|---|---|
| Trace status | One or more of ok, error, or timeout |
| Duration min / max (ms) | Traces inside a latency band |
| Span count min / max | Shallow or deep traces |
| Error count min / max | Traces by how many errors they recorded |
| Trace name contains | A substring of the trace name |
| Service name contains | A substring of the service name |
| User ID | One user's traffic |
| Session ID | One session |
| Has LLM spans | Only traces that actually called a model |
| Has tool spans | Only traces where tools were called |
| Has RAG / retrieval spans | Only traces with retrieval steps |
| Search | Free text across the trace |
As you change them, a live preview tells you how many traces will run, how many match the filter, and how many exist in total - so you can tighten the filter before spending the run rather than after.
Filters are the difference between a dataset that reflects your product and one that reflects your noisiest endpoint. If you are building a dataset to evaluate RAG quality, set Has RAG / retrieval spans - otherwise you will fill it with items your retrieval scorers cannot grade, and they will all come back as -1.
Select Run Job only after the live preview matches the intended project, environment, and population. The server rejects an explicit count above 100,000. For time ranges and All traces, it caps execution at 100,000 rather than rejecting the request.
ETL run history
The Activity tab shows Total Runs, Traces Processed, Items Created, and Success Rate across the job's history. The Runs tab is the execution-history table: open an individual run there to inspect its status, counts, duration, and trace-level errors.
A run does not have to be all-or-nothing. Individual traces can fail while the rest succeed, and each run keeps its own list of trace errors with the reason. That list is the fastest way to find a mapper bug: if 200 traces succeeded and 12 failed, open the 12 and look for what they have in common - usually a field the mapper assumes is present.
The expected result is a completed run whose trace count, created-item count, errors, and destination dataset match the preview. Processed traces and created items may differ because a mapper can skip a trace or return multiple items.
Cancel, retry, and troubleshoot
Pending and running executions can be cancelled from their run controls. When Retry is available, it uses the job's currently saved mapper, so preview that version before retrying a mapper-related failure.
| Symptom | What to check |
|---|---|
| Preview says no traces will run | Date/count scope, project and environment, advanced filters, and Skip already processed traces |
| Run processed traces but created no items | Preview the mapper and confirm transform(trace) returns an object or non-empty list for the same trace shape |
| Only some traces failed | Open the run's trace-error list and compare missing fields, span structure, or serialized attributes across failures |
Items exist but scorers return -1 | Compare mapper output with each scorer's required StandardData fields |
| A mapper change caused a broad regression | Restore a saved mapper version, preview it on one of the failing traces, then run a small bounded batch |
| Realtime items stopped arriving | Confirm the job is enabled, configured, on the expected environment, and that new traces match its saved scope |
Versions and rollback
Every time you save the mapper, the job keeps a version. History shows each version's source, age, and description and lets you restore it. Preview the version against a representative trace before using it for another run.
A mapper change can alter the shape of every item it produces, which in turn changes what your scorers can grade. If evaluation scores move sharply after an edit, compare the mapper version used for each run and preview the relevant version before assuming your agent regressed.
Automatic processing
Instead of running by hand, a job can process new traces continuously as they arrive. Use it once the mapper is stable and you want the dataset to keep pace with production. Until then, manual runs give you a chance to inspect the output.
Cloning a job
Clone copies the name, project, environment, target dataset and mapper code into a new job. The usual reason is a second environment - the same mapping logic pointed at staging rather than production - or a variant mapper you want to try without disturbing the one that works.
Every clone starts disabled. Review its source environment, destination dataset, mapper version, and preview output first, then enable it only when it is ready for realtime processing.
Limits
Organizations have caps on the number of ETL jobs, the number of enabled jobs, and daily AI mapper generations. If you hit one you will see ETL_JOBS_LIMIT_EXCEEDED, ETL_ENABLED_JOBS_LIMIT or MAPPER_GENERATIONS_DAILY_LIMIT. Disabling jobs you are no longer running frees the enabled-job allowance.
API outcomes and retries
Triggered runs expose tracesProcessed, tracesFailed, tracesWithoutItems, and traceErrors. tracesWithoutItems counts successful mappings that produced no usable items and is included in tracesProcessed. An intentional empty mapping is not an error. Missing requested traces, failed span lookups, and missing expected spans are recorded as failures with their trace IDs.
A completed run has finished attempting its selected traces; check tracesFailed to detect partial failures. With the default skipProcessed: true, a new run retries recorded failures and skips previously successful traces. All failure IDs are retained. Progress counters update after each batch; the full error list is saved when a run completes, fails, or is cancelled. Older runs with incomplete error records retry only their recorded failures, so successful traces are not automatically duplicated. To recover other missing traces, select only their IDs and send skipProcessed: false. Partial success completes without a whole-run queue retry; a run with no processed traces can still retry automatically.
During processing, updatedAt receives a heartbeat every 15 seconds, including while span queries are waiting or retrying. Spans are fetched in one query per processing batch, with 10 traces per batch by default. Throughput depends on database load, span volume, and mapper runtime; there is no fixed traces-per-second guarantee. Compare completed-run duration and processed counts for your workload.
Next steps
- ETL jobs overview - what an ETL job is and how to create one
- Using the AI mapper - generating and improving the mapper code
- Eval jobs - scoring the dataset once it exists