
Deep framework integrations
LangChain, LangGraph, LiveKit, Pipecat, CrewAI, LlamaIndex, AutoGen, and OpenTelemetry: real instrumentation, not thin wrappers. The LangChain callback alone covers LLM, chain, agent, tool, and retrieval events.
Observability
NovaTrace captures every LLM call, tool invocation, retrieval, and agent step: with tokens, cost, and latency attached. One SDK, deep framework integrations, and a transport layer that never takes your app down.
6M+
traces ingested per day
15,000
spans/sec, load-tested
15 min
from install to first trace
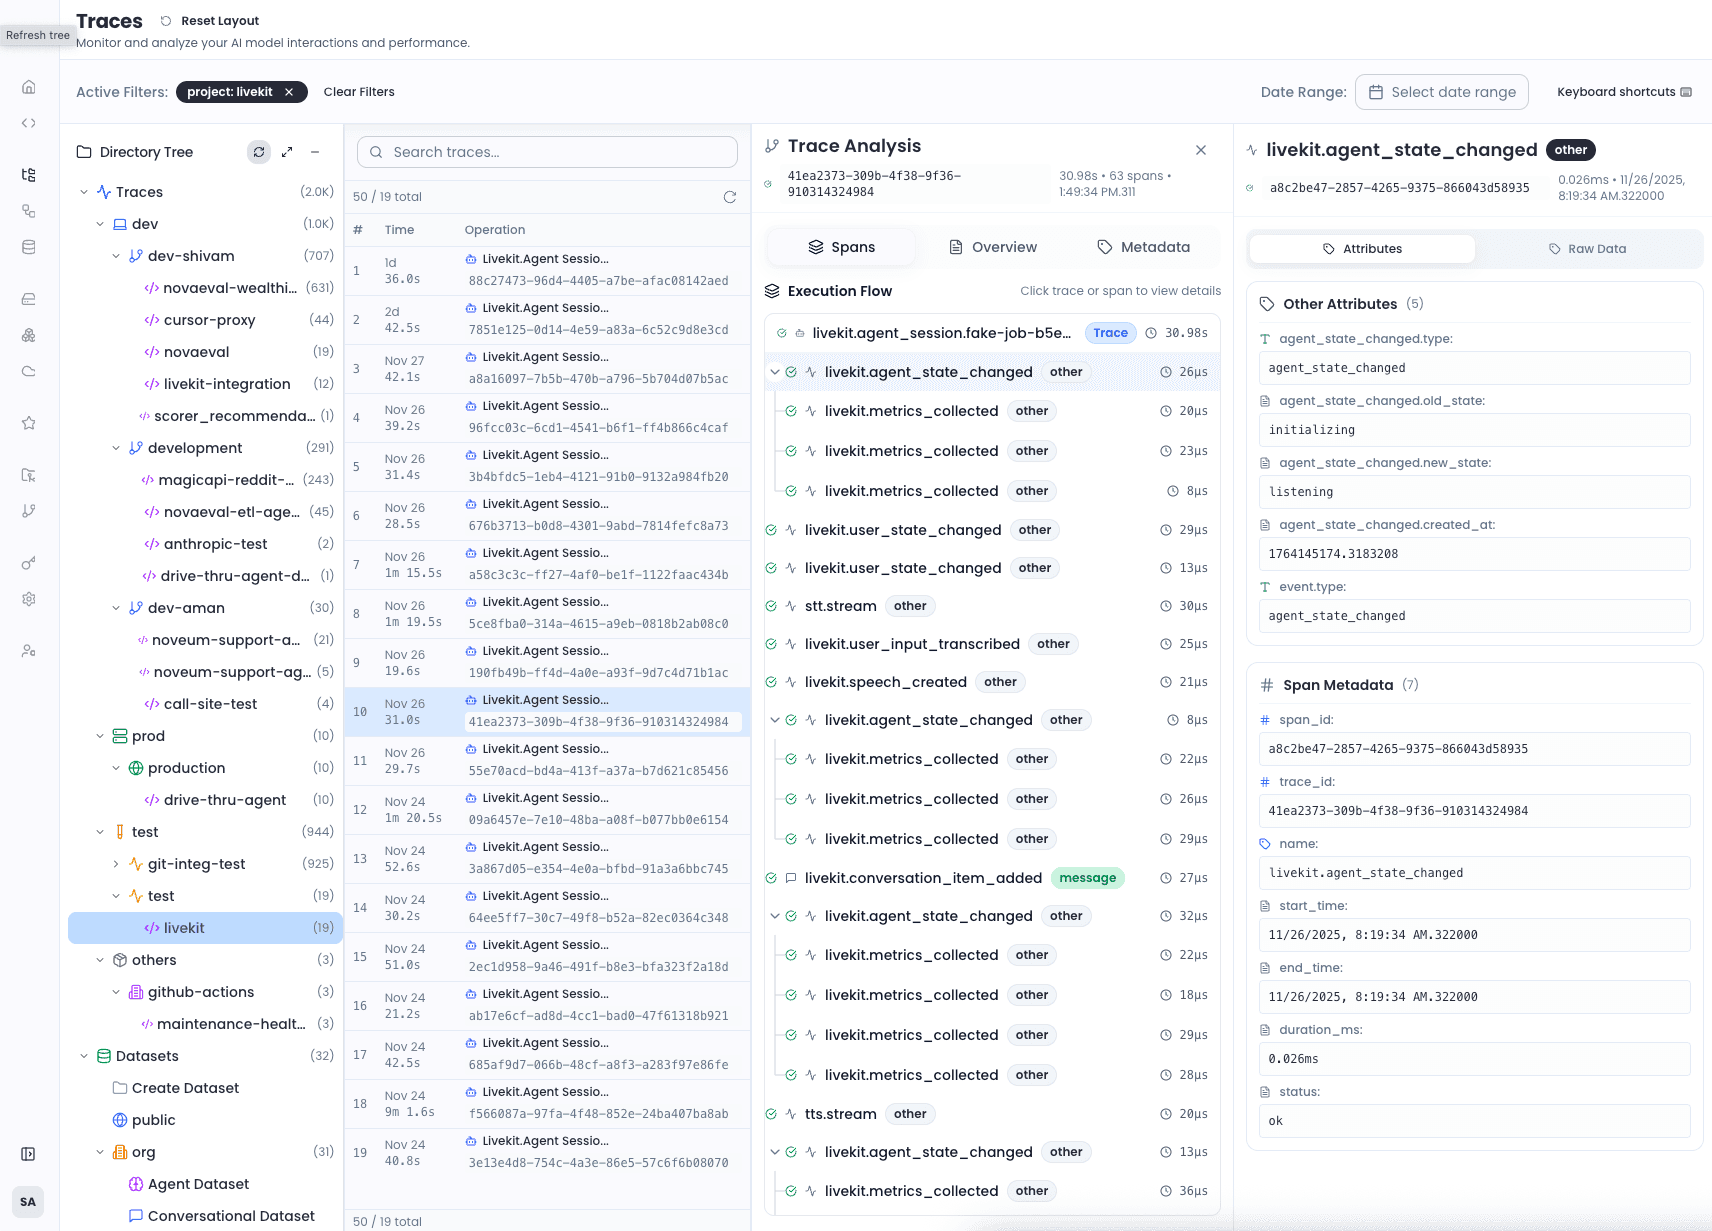
01: Capabilities
LangChain, LangGraph, LiveKit, Pipecat, CrewAI, LlamaIndex, AutoGen, and OpenTelemetry: real instrumentation, not thin wrappers. The LangChain callback alone covers LLM, chain, agent, tool, and retrieval events.
An embedded registry spanning 40+ models across 11 providers prices every call as it happens: input, output, and total tokens plus cost on each span: so cost-per-trace and cost-per-customer are queryable from day one.
Conversation threads, agent registries, and workflow graphs keep multi-agent systems legible: who did what, in which order, and why.
Audio and image artifacts upload alongside spans: the raw material that voice and vision evals need.
Batched, retried, sampled, and silent on failure. Tracing never takes your application down: a guarantee, not a goal.
Traces, spans, attributes, and events that map cleanly onto OTel concepts, with a purpose-built wire format for LLM workloads.
02: Integration
One init call plus the integration for your stack: and our engineers do it with you on the kickoff call.
from noveum_trace.integrations.langchain import ( NoveumTraceCallbackHandler,) handler = NoveumTraceCallbackHandler() agent.invoke( {"input": question}, config={"callbacks": [handler]},)What gets captured
Python 3.9–3.13 · OpenTelemetry-aligned · MCP server included
03: Under the hood
A columnar trace store, open-source SDKs, an embedded cost registry, and an MCP server: the concrete pieces that make agent observability queryable.
Storage engine
A ClickHouse columnar backend purpose-built for trace volume: faster aggregations and materially lower storage cost than Elasticsearch on the same workload.
Open-source SDKs
Python `noveum-trace` (3.9–3.13) and TypeScript `@noveum/trace`: instrument with decorators and context managers, one init call to start streaming spans.
Model & cost registry
An embedded registry covering 40+ models across 11 providers: OpenAI (gpt-4o, o1, o3, gpt-5), Anthropic Claude 3/3.5/4.5, Google Gemini 1.5/2.0/2.5, Cohere, Mistral, Meta Llama, DeepSeek, xAI Grok, Perplexity, Amazon Bedrock, and AI21.
Per-span economics
Input, output, and total token counts plus computed cost are attached to every span as it’s captured: cost-per-trace and cost-per-customer are queryable from day one, no post-processing.
Native integrations
First-class instrumentation for LangChain, LangGraph, LiveKit, Pipecat, CrewAI, LlamaIndex, AutoGen, and OpenTelemetry: real callbacks, not thin wrappers.
MCP server
An MCP server with ~60 tools, generated from the OpenAPI spec, exposes traces, spans, and metrics to your own agents: query and act on observability data in-loop.
The loop
Everything downstream: evals, simulations, guardrails, fixes: runs on the traces NovaTrace captures. It’s step one for a reason.
Trusted in production by enterprise and high-growth teams