Traces - Request Journeys
Understanding traces and how they represent complete request journeys through your AI application
A trace represents the complete journey of a request through your AI application, from the initial input to the final output. Think of it as a story that shows how your application processes a single user request.
🎯 What is a Trace?
A trace is a distributed operation that can span multiple services, functions, and external API calls. In AI applications, a trace typically represents:
- A single user query through your chatbot
- A complete RAG pipeline from question to answer
- An agent workflow with multiple steps and decisions
- A batch processing job with multiple AI operations
🏗️ Trace Structure
Every trace contains:
- Trace ID: Unique identifier for the entire request
- Root Span: The main operation that started the trace
- Child Spans: Sub-operations within the main operation
- Attributes: Key-value pairs with metadata
- Events: Point-in-time occurrences during execution
- Status: Success, error, or other completion state
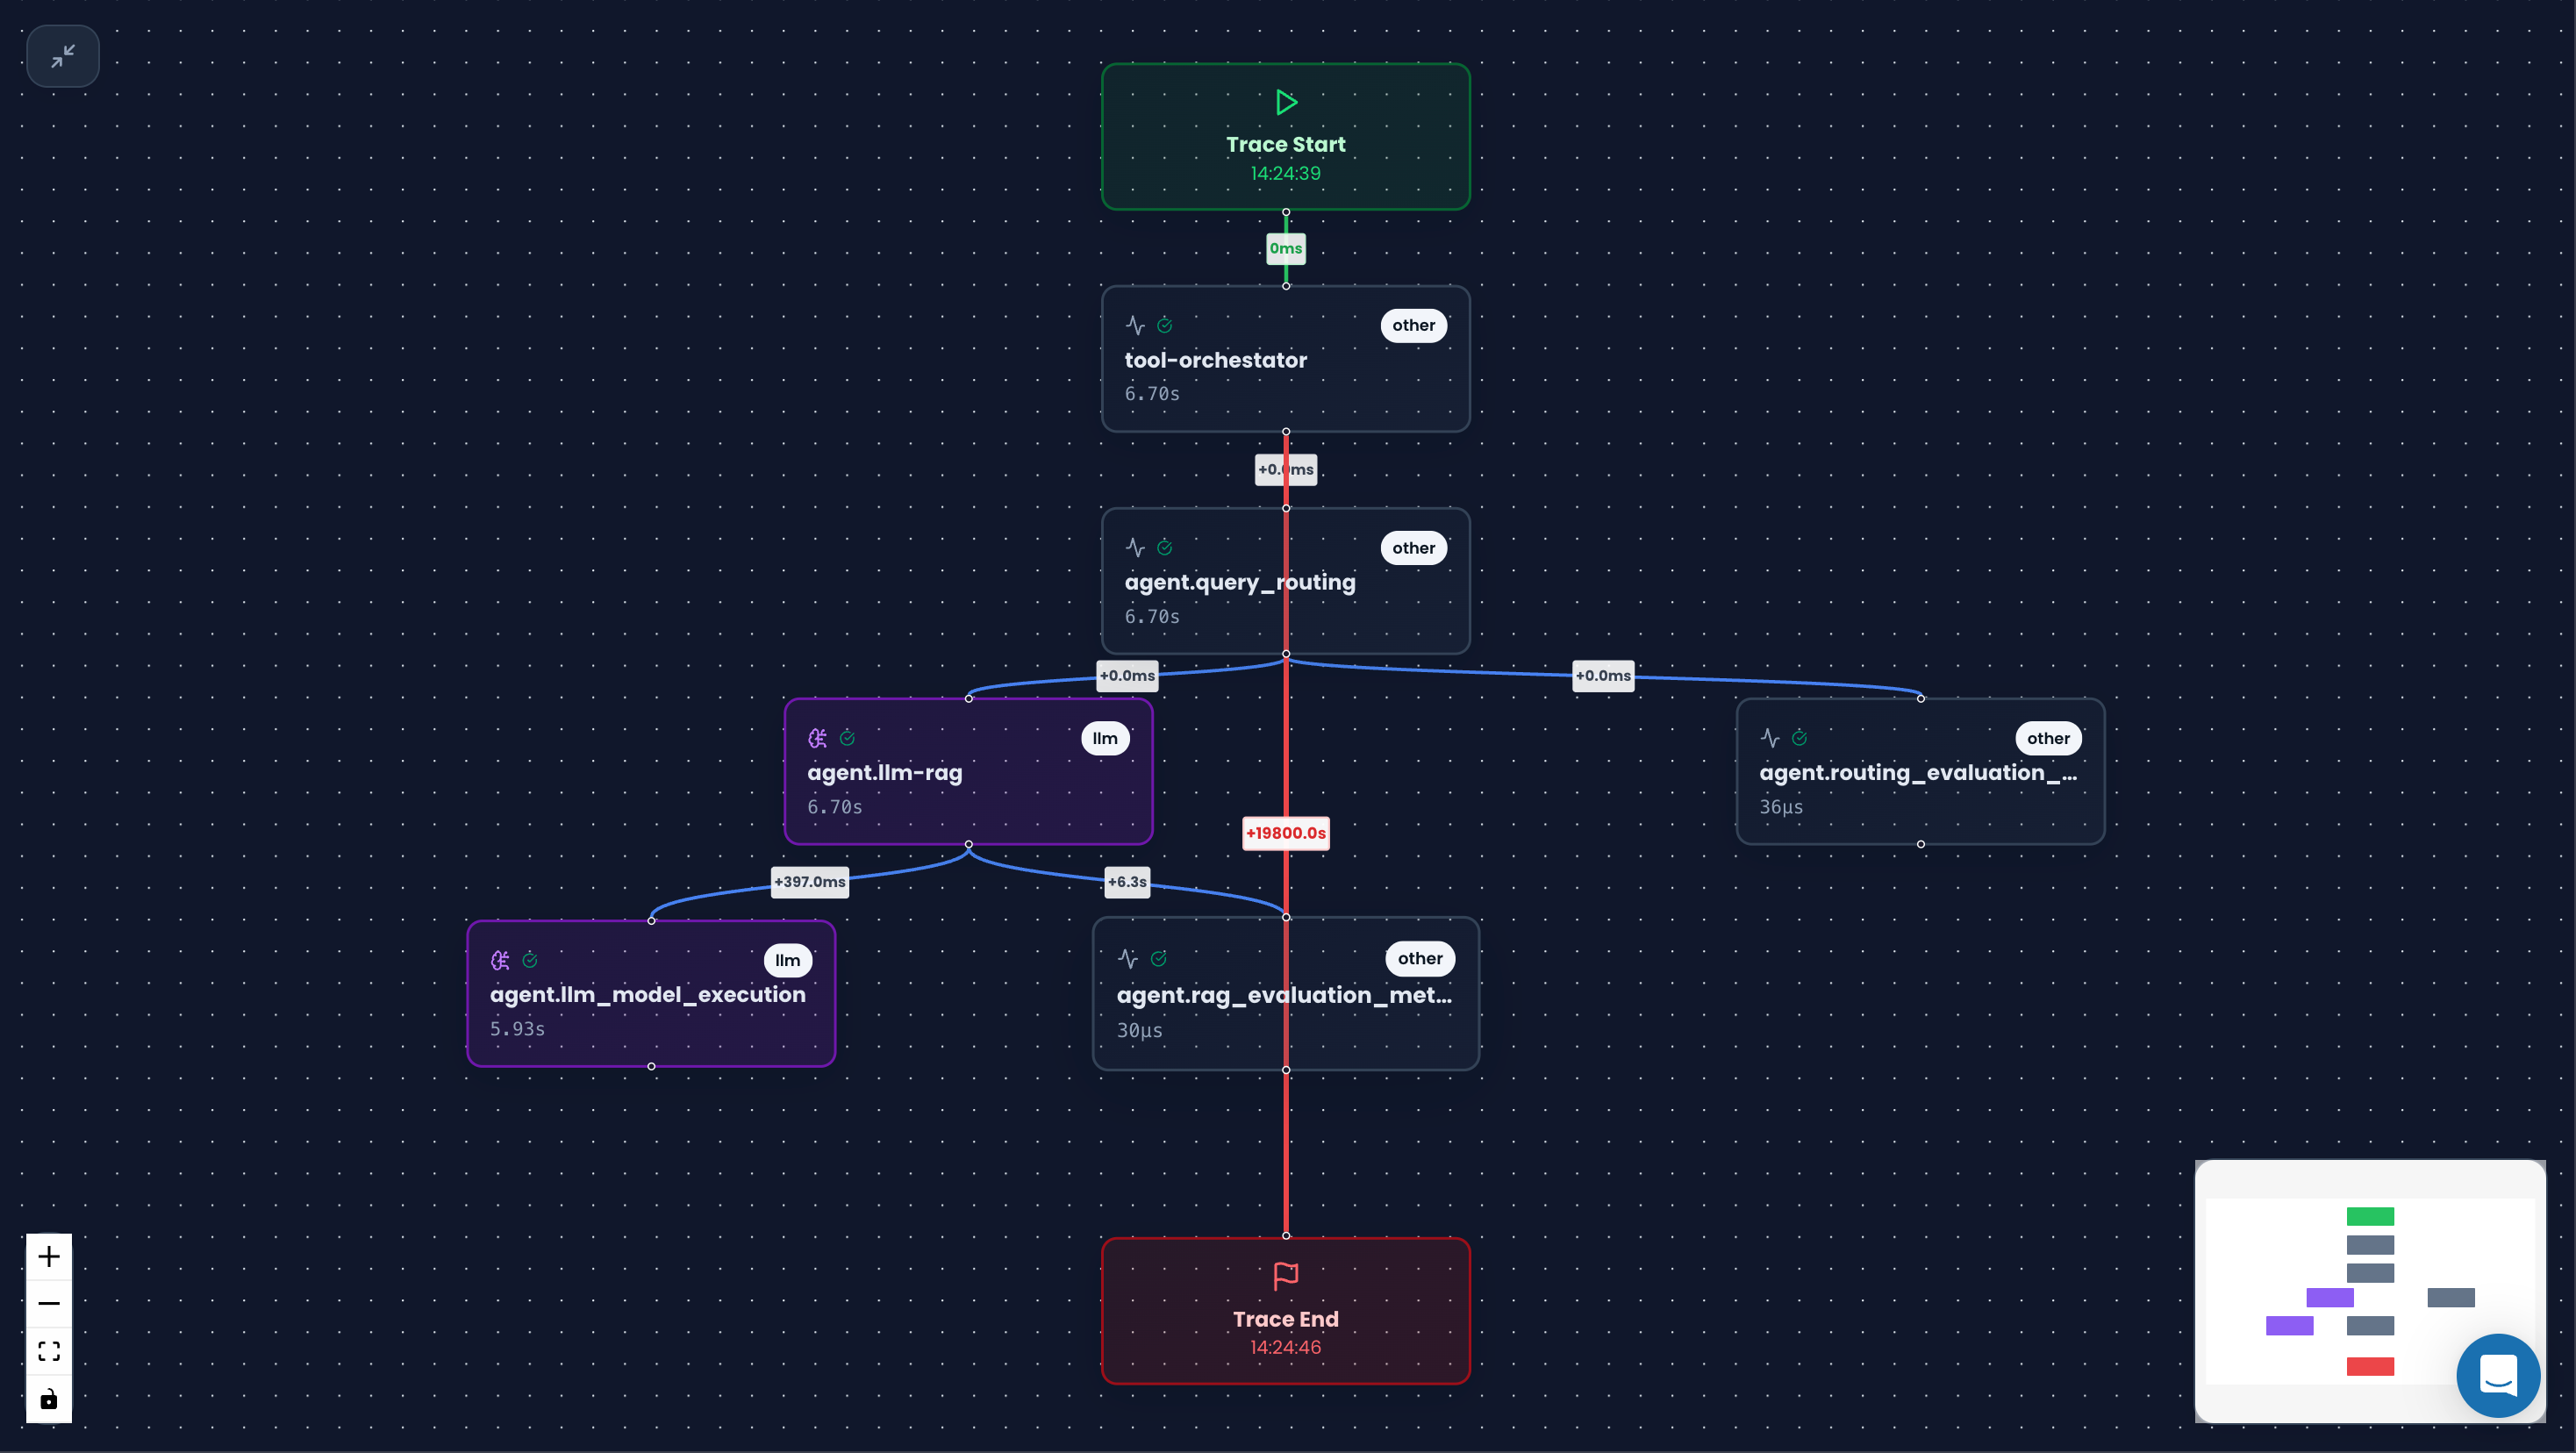
📊 Visual Timeline
Here's how a trace looks in the Noveum dashboard:
🔄 Trace Lifecycle
1. Trace Creation
A trace is created when a new request starts:
2. Span Addition
Spans are added as the request progresses:
3. Trace Completion
The trace is automatically completed when the root span ends:
🎯 Trace Patterns in AI Applications
Simple LLM Call
RAG Pipeline
Multi-Agent Workflow
📈 Trace Attributes
Traces can contain rich metadata through attributes:
System Attributes
Business Attributes
AI-Specific Attributes
🎪 Trace Events
Events represent point-in-time occurrences during trace execution:
Business Events
AI Events
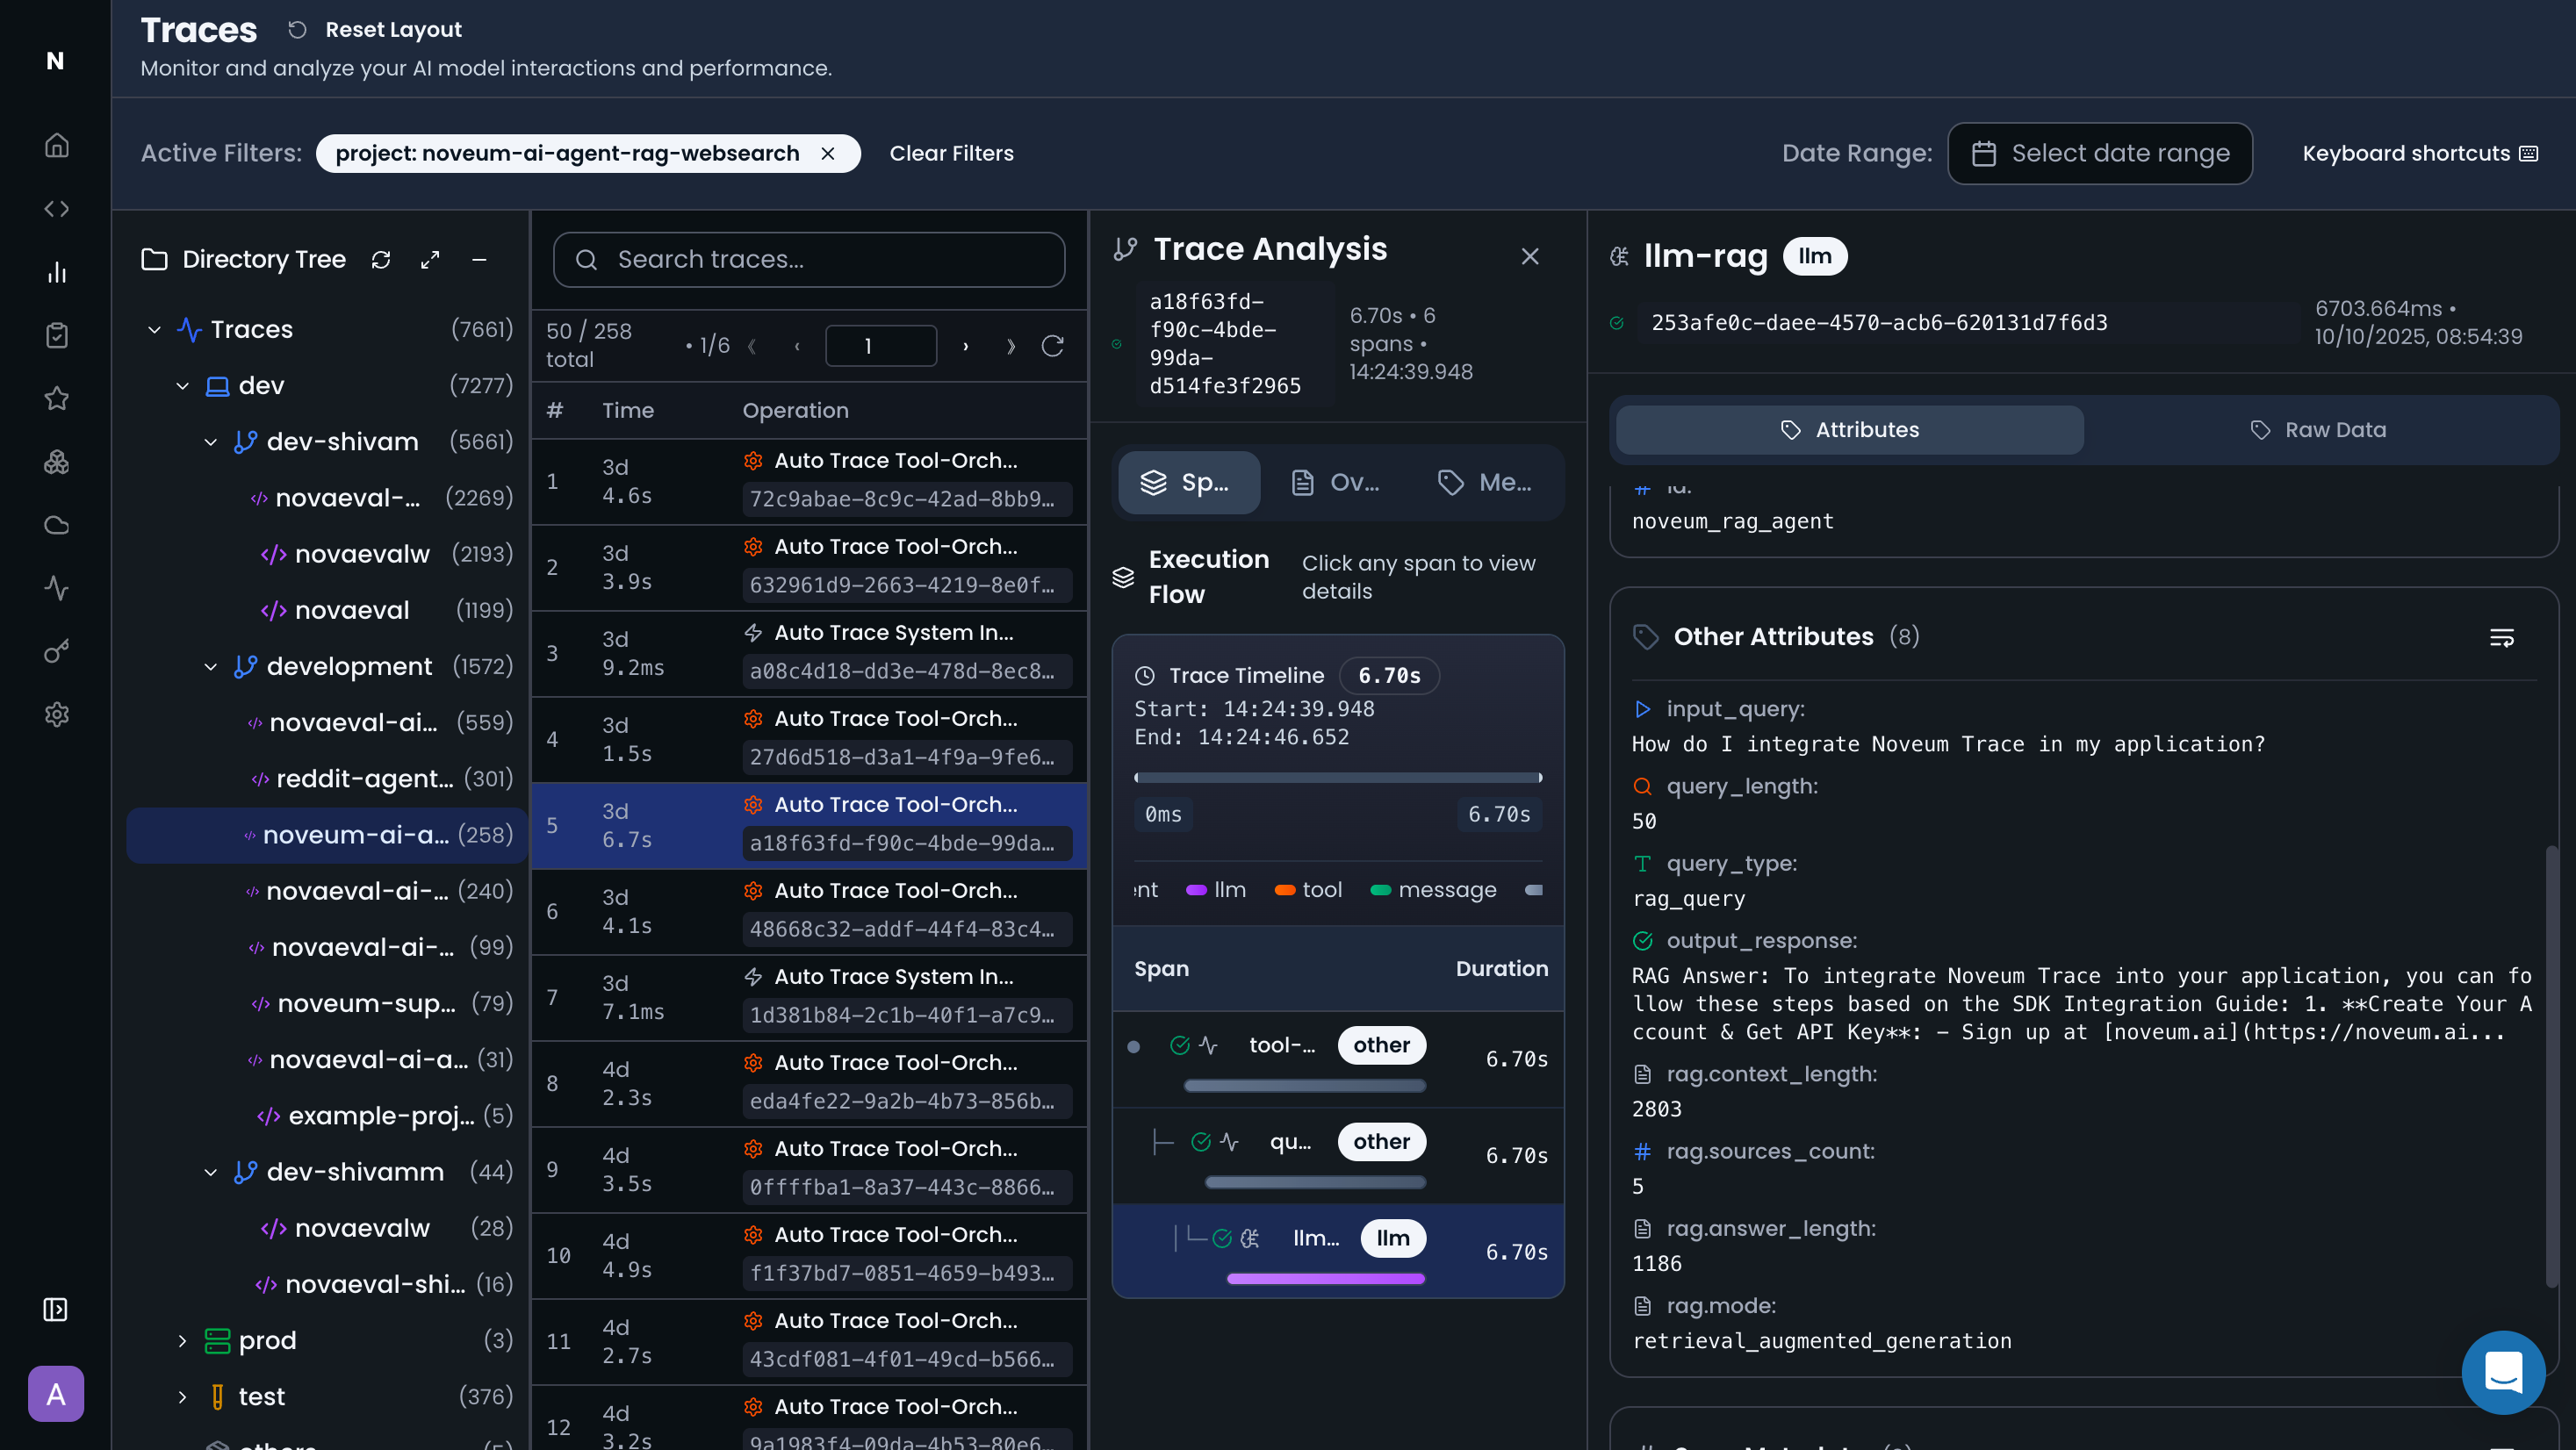
🔍 Trace Analysis
Performance Analysis
- Duration: Total time from start to finish
- Latency: Time spent in each operation
- Bottlenecks: Slowest operations in the trace
- Throughput: Requests processed per second
Cost Analysis
- Token Usage: Input and output tokens
- API Costs: Cost per provider and model
- Total Cost: End-to-end request cost
- Cost Attribution: Which operations drive costs
Quality Analysis
- Success Rate: Percentage of successful requests
- Error Patterns: Common failure points
- Response Quality: AI output quality metrics
- User Satisfaction: Business quality indicators
🚀 Next Steps
Now that you understand traces, explore these related concepts:
- Spans - Individual operations within traces
- Attributes - Metadata and context
- Events - Point-in-time occurrences
Best Practices
- Traces Best Practices - Learn how to create effective traces
Traces are the foundation of observability in AI applications. They provide the complete picture of how your application processes requests, making it easy to understand, debug, and optimize your AI workflows.
Get Early Access to Noveum.ai Platform
Be the first one to get notified when we open Noveum Platform to more users. All users get access to Observability suite for free, early users get free eval jobs and premium support for the first year.