
Browse all organization traces
Search and filter the flat organization-wide trace table, then inspect one trace in a non-modal resizable detail sheet.
Open Organization > All Traces when you know a trace name, identifier, project, service, or time window and want one flat table across the active organization.
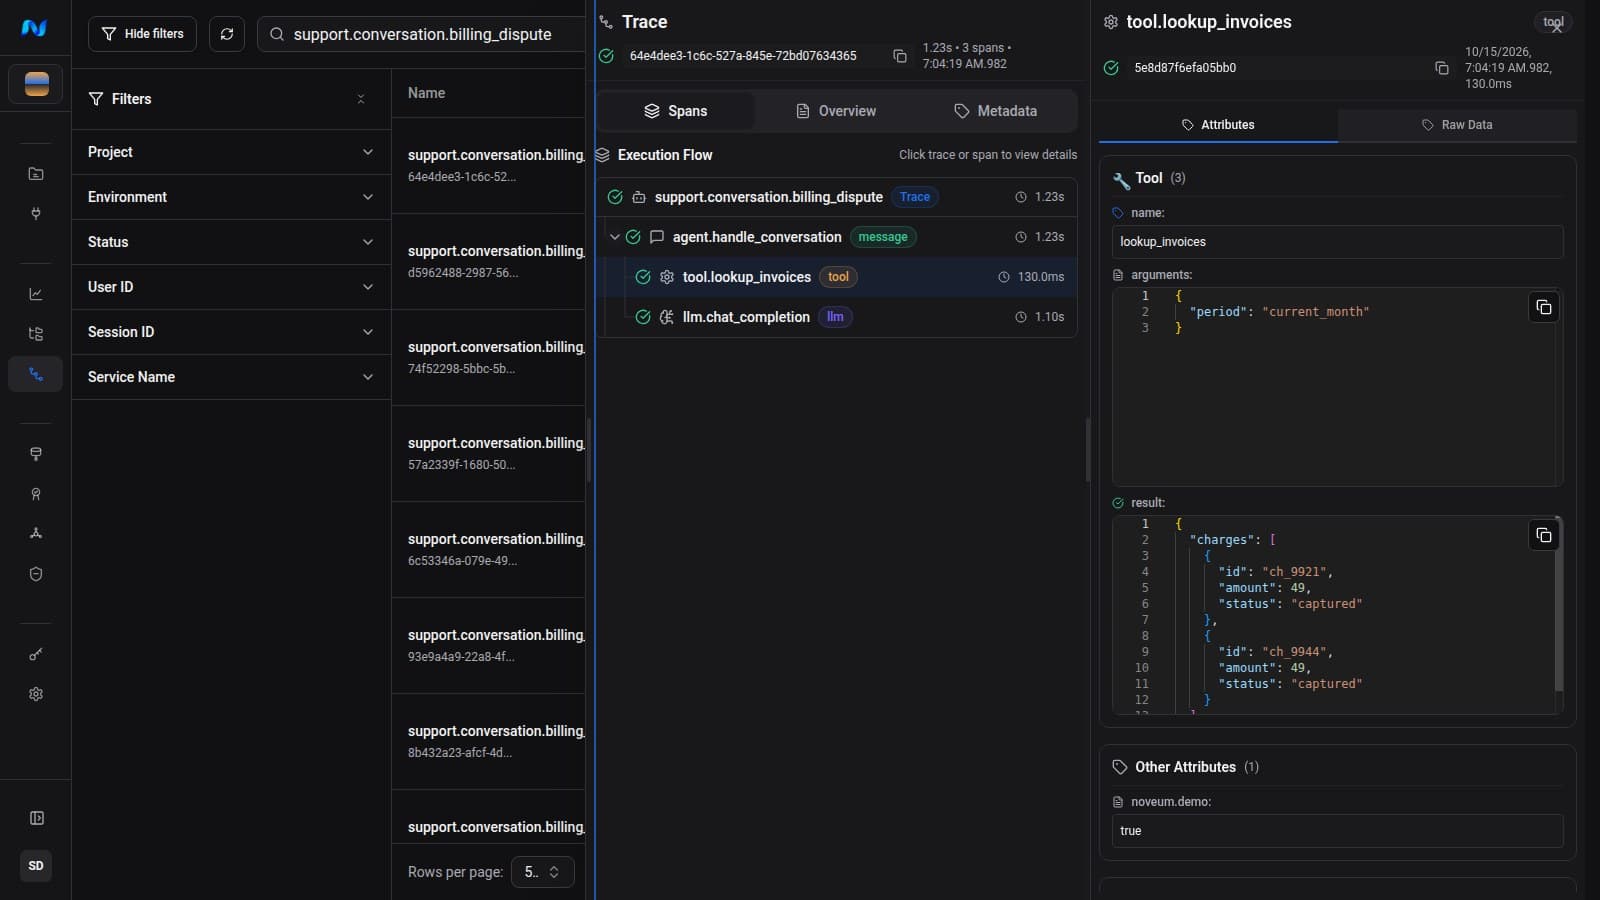
Search and filter
Use the header and filter sidebar to combine:
- free-text search across trace name, trace ID, project, environment, status message, user ID, session ID, request IDs, attributes, tags, and custom attributes;
- Project, Environment, Status, User ID, Session ID, and Service name filters;
- a trace start-time date range;
- visible table columns and page size;
- refresh without clearing the current query.
The organization in the application shell defines the data boundary. Filters narrow results but do not move or rewrite traces. If a known trace is absent, widen the date range and clear structured filters before changing the search text.
Inspect one trace
Select a row to open the detail sheet from the right. The sheet is resizable and non-modal. Its Spans, Overview, and Metadata tabs expose the same trace inspection model used by Project Traces.
Use Spans to follow the execution tree and select an individual operation. Use Overview for trace-level timing and counts. Use Metadata to verify the recorded service, environment, SDK, tags, and custom attributes.
A Runs View trace link can open All Traces with its source trace selected. That path is useful when you start from a failed evaluation check and need to verify the original execution.
Choose the right trace view
| View | Scope | Best for |
|---|---|---|
| All Traces | Organization | Direct search and structured filtering across projects. |
| Explorer | Organization | Browsing the Traces and Datasets directory before inspecting a result. |
| Project Traces | One project | The same flat table already constrained to a project, without a Project filter. |
Continue with noveum-trace or turn representative traces into a dataset.