Dashboard Overview
Navigate the Noveum platform and understand key metrics for your AI applications
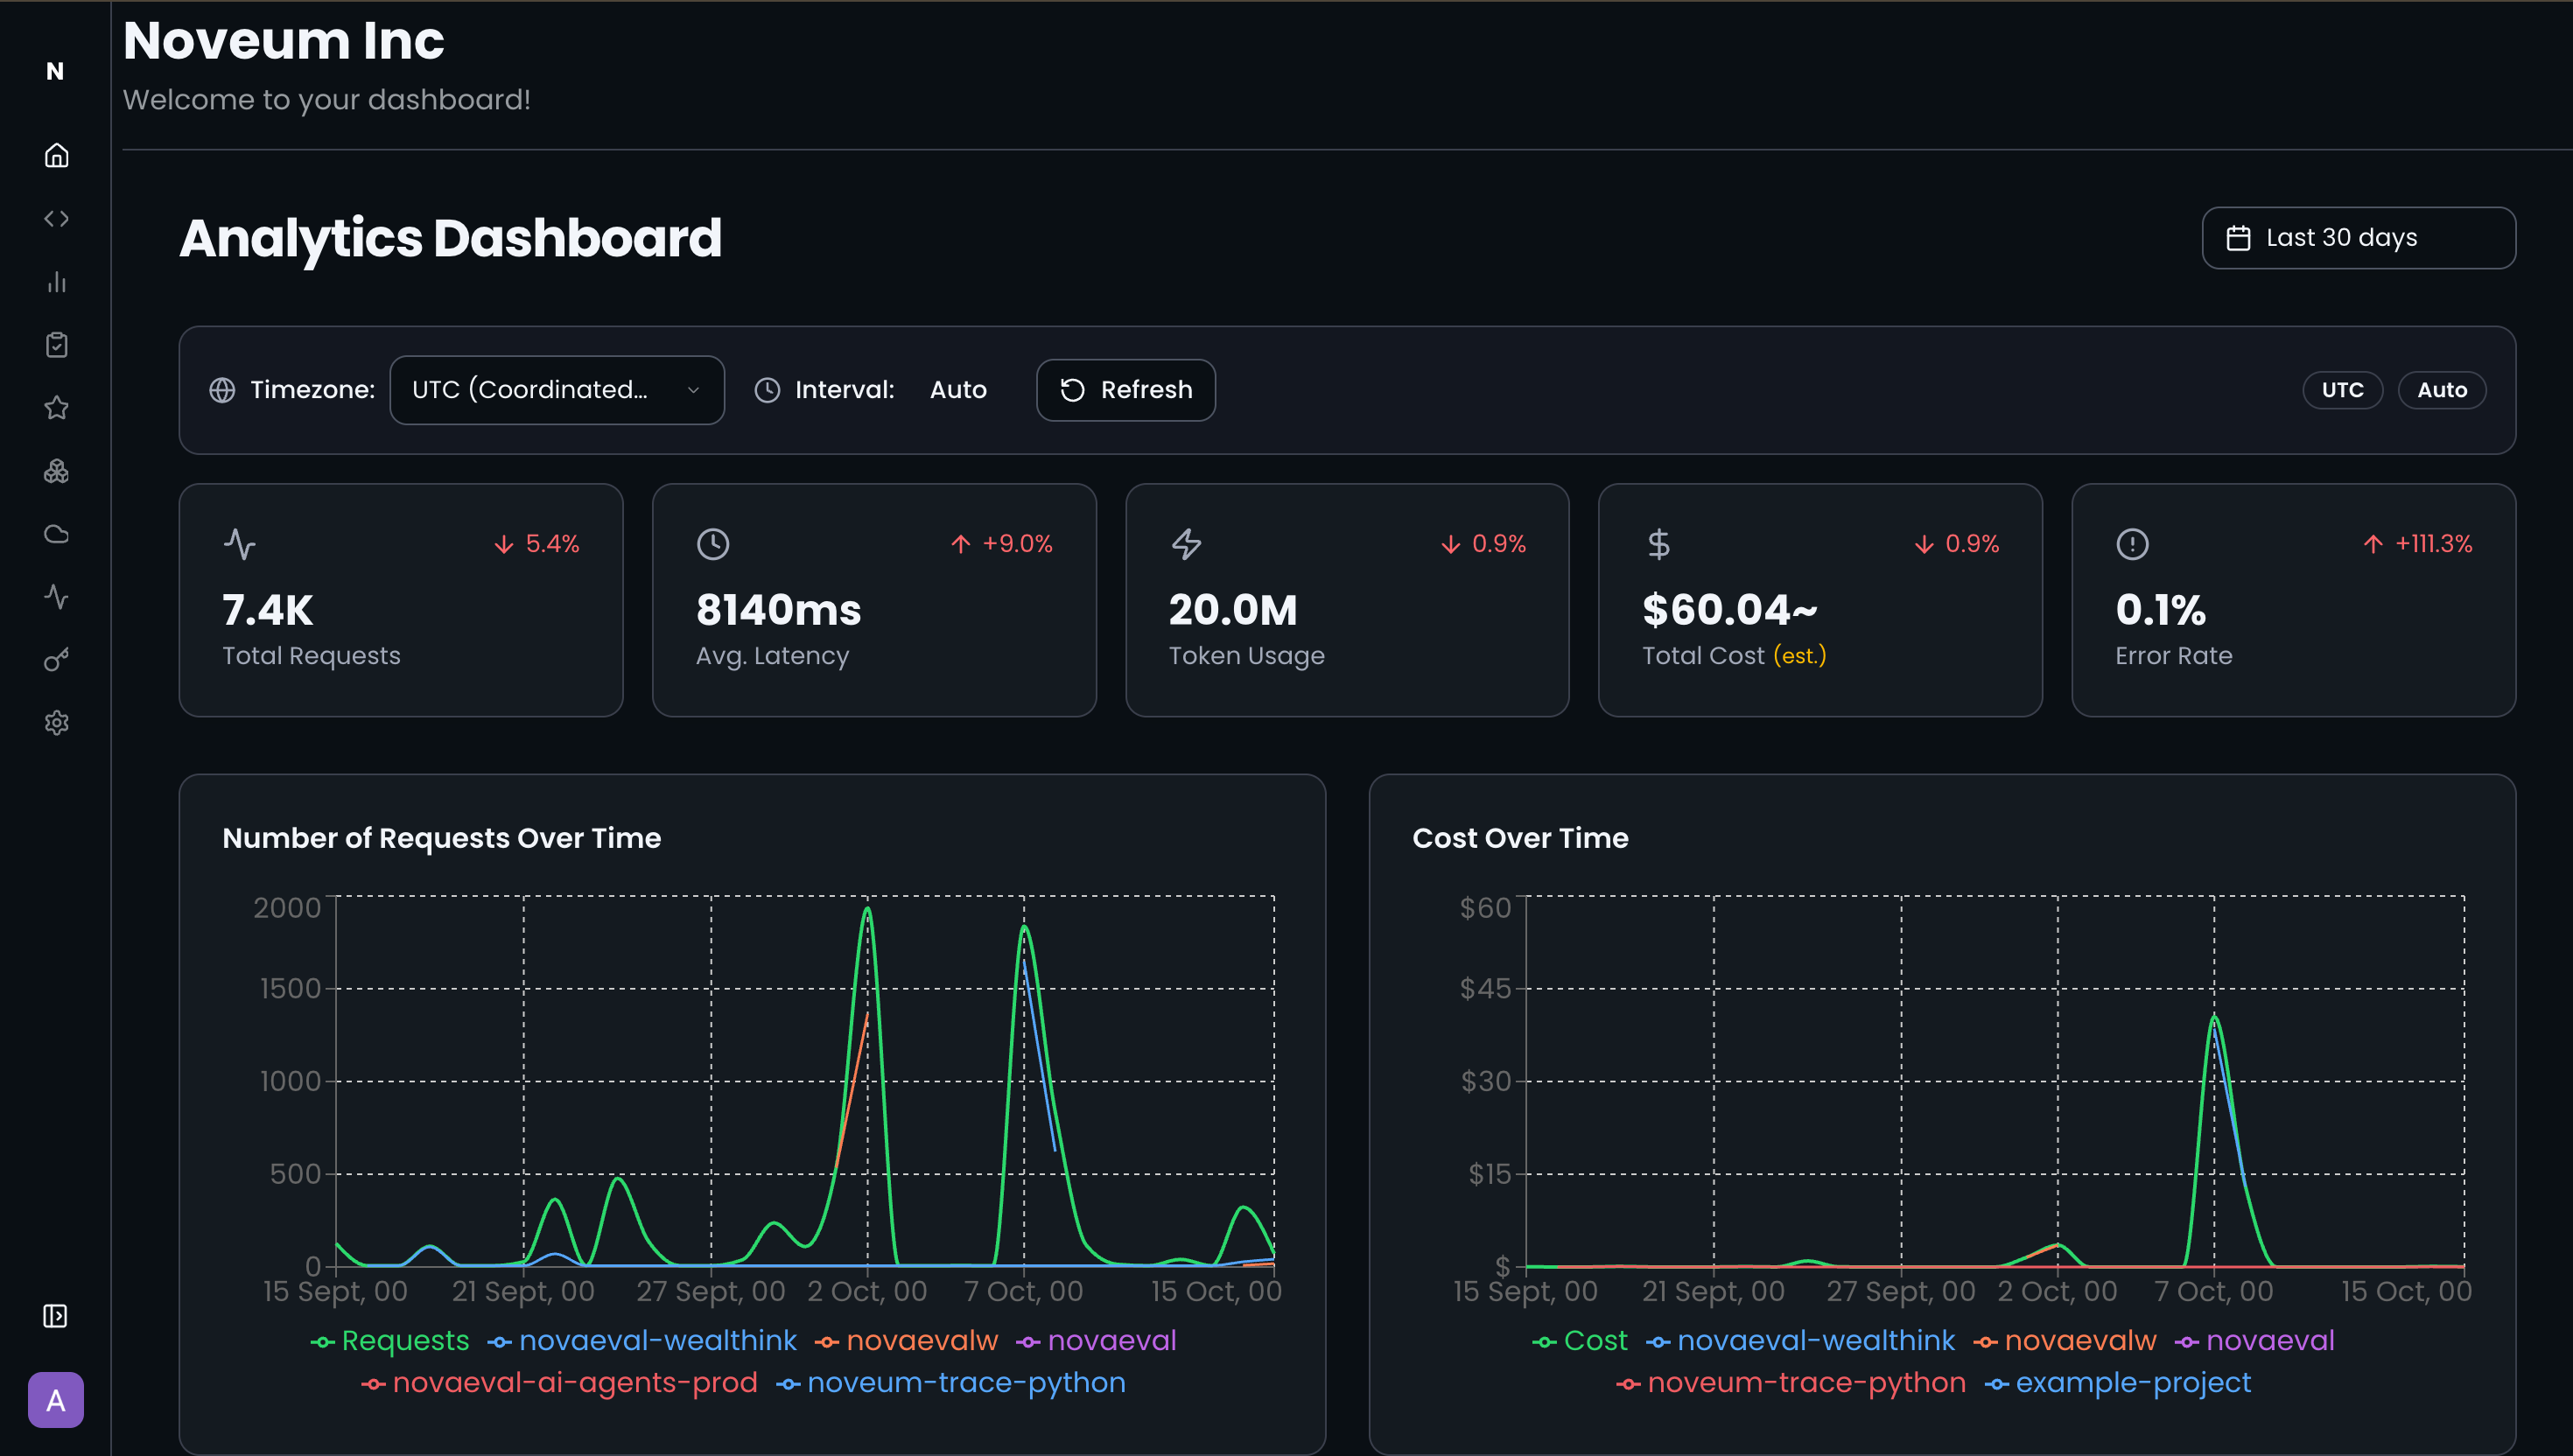
The Noveum.ai dashboard provides comprehensive visibility into your AI application's performance, giving you real-time insights into traces, costs, and system health. Built specifically for AI workloads, it offers both high-level analytics and detailed trace inspection capabilities.
🎯 Key Dashboard Features
Real-Time Traces Monitoring
- Live Trace Stream: Monitor LLM calls, RAG operations, and agent activities in real-time
- Advanced Filtering: Filter by project, environment, status, date ranges, and custom attributes
- Search Functionality: Quickly find specific traces using full-text search across all trace data
- Status Indicators: Visual status badges for success, error, and pending operations
Performance Analytics
- Latency Metrics: Track response times across different operations and time periods
- Cost Analysis: Monitor spending across different LLM providers and operations
- Throughput Monitoring: Observe request volumes and system capacity
- Error Rate Tracking: Identify and monitor failure patterns
Interactive Trace Inspection
- Detailed Trace View: Expand any trace to see complete request/response data
- Span Hierarchy: Navigate complex multi-step operations with visual span trees
- Timing Analysis: Understand where time is spent in your AI operations
- Context Preservation: See how data flows through embeddings, retrievals, and generations
📊 Dashboard Components
Traces List Interface
The main traces interface offers two viewing modes:
Classic Interface
- Tabular view of all traces with sortable columns
- Quick filtering and search capabilities
- Expandable detail panels for trace inspection
Three-Pane Interface
- Directory tree navigation for complex trace hierarchies
- Split-pane view for simultaneous trace browsing and detail inspection
- Advanced filtering with visual feedback
Filter Controls
- Environment Filter: Switch between development, staging, and production
- Project Filter: Focus on specific applications or services
- Status Filter: View only successful, failed, or pending operations
- Date Range: Analyze performance over custom time periods
- Clear Filters: Quick reset to view all traces
Connection Status
- Real-time Status: Monitor connection health to your trace storage
- Error Reporting: Clear error messages when connectivity issues occur
- Refresh Controls: Manual refresh capability for troubleshooting
🔍 Trace Detail Analysis
Comprehensive Trace Information
Each trace provides detailed insights including:
- Basic Metadata: Timestamp, duration, status, project, and environment
- Request Context: User ID, session ID, and custom attributes
- Response Data: Complete LLM responses, tool outputs, and generated content
- Performance Metrics: Token usage, costs, and timing breakdowns
- Error Details: Stack traces and error context when operations fail
Span Analysis
- Operation Types: Automatic categorization of LLM calls, vector searches, tool usage
- Attribute Inspection: View all custom attributes and metadata
- Timing Visualization: Understand operation sequencing and bottlenecks
- Parent-Child Relationships: Navigate complex workflow hierarchies
Flow Visualization
- Interactive Flow Charts: Visual representation of operation sequences
- Dependency Mapping: See how different components interact
- Error Path Analysis: Trace failure points through your system
🎨 Interface Customization
Layout Options
- Responsive Design: Optimized for desktop and mobile viewing
- Panel Sizing: Adjustable interface panels for different screen sizes
- Dark/Light Themes: Switch between themes for comfortable viewing
Data Display
- Sortable Columns: Sort traces by any metric (time, duration, cost, status)
- Configurable Views: Customize which trace attributes are displayed
- Export Capabilities: Download trace data for external analysis
📈 Getting Started with the Dashboard
Initial Setup
- Connect Your Applications: Ensure your AI applications are instrumented with Noveum SDKs
- Verify Data Flow: Check the connection status indicator for successful trace ingestion
- Explore Filters: Use environment and project filters to focus on relevant data
Best Practices
- Set Up Projects: Organize your applications into logical projects for better filtering
- Use Environments: Separate development, staging, and production traces
- Monitor Regularly: Check dashboard daily for performance trends and issues
- Deep Dive on Errors: Use detailed trace inspection to troubleshoot failures
Performance Tips
- Filter Early: Use filters to reduce data volume for faster loading
- Time Range Selection: Limit date ranges for better performance with large datasets
- Regular Refresh: Enable auto-refresh for monitoring live systems
🔗 Integration with Other Platform Features
The dashboard seamlessly integrates with other Noveum platform capabilities:
- Projects: Filter and organize traces by project structure
- Team Collaboration: Share trace URLs with team members for collaborative debugging
- API Access: Export trace data programmatically using the Noveum API
- Alert Systems: Set up notifications based on dashboard metrics
Agent Health Dashboard
The Agent Health Dashboard is a per-project view that summarizes evaluation quality across all your datasets and scorers in one place. Navigate to Project → Health to open it.
Summary metrics
The top row shows five aggregate cards:
| Metric | Description |
|---|---|
| Total Runs | Number of items evaluated across all selected scorers |
| Total Tokens | Tokens consumed by LLM-as-judge scorers in the last 24 hours |
| Total Cost | Estimated cost of judge calls (badge shown if estimated) |
| Success Rate | Percentage of evaluated items that passed their scorer thresholds |
| Failure Rate | Percentage that ran but did not pass |
Dataset filter
Use the Dataset dropdown to limit the health view to a single dataset or view all at once.
Scorer quality cards
Below the summary, each scorer appears as a card showing the scorer name, total evaluations, and a configurable score display:
| Display mode | What it shows |
|---|---|
| Average | Mean score across all evaluations |
| P75 / P90 / P95 / P99 | Percentile — the score below which that percentage of items fell |
Use P90 or P95 to catch tail failures that averages hide.
Click any scorer card to open the Scorer Detail view, which breaks down results by dataset and shows per-item scores.
Prerequisites
The Agent Health Dashboard requires at least one dataset linked to the project. If no datasets exist, the page shows a warning with a direct link to create one.
💡 Advanced Features
Custom Attributes
- Search by Attributes: Find traces using custom metadata you've added
- Attribute Filtering: Create complex filters using custom attributes
- Attribute Visualization: See custom data alongside standard metrics
Bulk Operations
- Multi-Select: Select multiple traces for batch operations
- Bulk Export: Download multiple traces simultaneously
- Comparative Analysis: Compare performance across multiple traces
Real-Time Updates
- Live Refresh: Automatic updates as new traces arrive
- Connection Monitoring: Real-time status of your trace ingestion pipeline
- Performance Indicators: Live metrics for system health monitoring
Media Attachments
Noveum supports attaching audio and image files to individual traces and spans. Attachments are stored in object storage and referenced by the trace/span IDs they belong to.
Audio
- Endpoint:
POST /api/v1/audio(multipart/form-data) - Supported formats: MP3, WAV, AAC, OGG, FLAC, M4A
- Max size: 100 MB
- Required fields:
file,audio_uuid(UUID),traceId,spanId - Retrieve metadata:
GET /api/v1/audio/:id - Stream content:
GET /api/v1/audio/:id/serve— proxies raw bytes from storage - Delete:
DELETE /api/v1/audio/:id - Required permissions:
media:write/media:read/media:delete
NovaSynth uses this API automatically to store call recordings. The raw_complete_audio field in StandardData points to these recordings and is consumed by audio quality scorers (mos, tone_clarity, gibberish, etc.).
Images
- Endpoint:
POST /api/v1/image(multipart/form-data) - Supported formats: JPEG, PNG, GIF, WebP, SVG, BMP, TIFF
- Max size: 50 MB
- Required fields:
file,image_uuid(UUID),traceId,spanId - Retrieve metadata:
GET /api/v1/image/:id - Get signed URL:
GET /api/v1/image/:id/serve— returns a signed URL valid for 15 minutes, not raw bytes - Delete:
DELETE /api/v1/image/:id - Required permissions:
media:write/media:read/media:delete
Ready to dive deeper? Explore NovaEval to compare AI models and create datasets, or check out the Python SDK to integrate tracing into your applications.
Get Early Access to Noveum.ai Platform
Be the first one to get notified when we open Noveum Platform to more users. All users get access to Observability suite for free, early users get free eval jobs and premium support for the first year.